How Reliable Footfall Data Transforms Expansion Decisions
Expansion teams in retail, restaurants, fitness, and hospitality increasingly rely on footfall data to evaluate sites. But not all datasets are created equal. The difference between rough estimates and validated, high-resolution pedestrian counts can mean opening a location that thrives, or one that quietly underperforms.
This article explains how Targomo’s foot traffic data is structured, why it is trusted as one of the most accurate sources on the market, and how expansion leaders use it to reduce risk and make confident, data-based decisions.
Why Guesswork Is Not Enough
Expansion is a high-stakes process. Lease negotiations, build-out costs, and staffing investments mean a simple miscalculation on location can set a business back for years. Yet many decisions are still made using surface-level indicators: a street with active pedestrian movement, proximity to a landmark, or access to large demographic groups.
However, a busy street doesn’t always mean busy sales. A street may only be crowded at certain times of day. A high-traffic corridor may consist mostly of commuters rushing past, which won’t drive sales for fashion retail, for example. Without precise, validated insights, expansion becomes guesswork.

What Is Footfall Data?
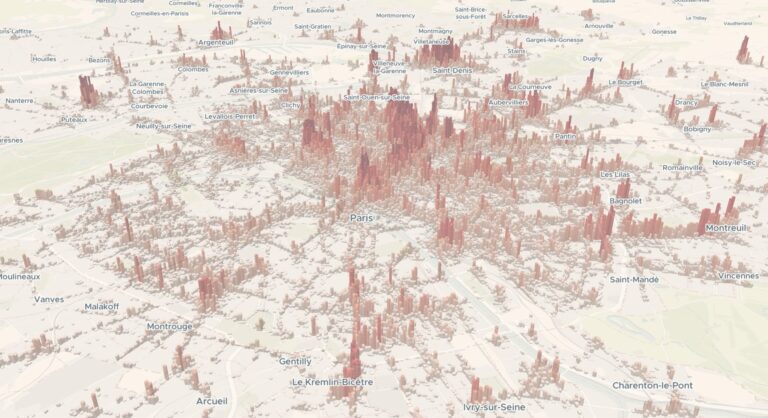
Footfall data measures how many people walk past a specific location on an average day. Targomo’s Foot Traffic data answers the practical questions expansion teams usually consider:
- How many people walk past this site daily?
- Which side of the street attracts more traffic?
- How do weekends compare with weekdays?
- Where are peak hours of activity, and how do they shift seasonally?
With these insights, expansion is no longer based on assumptions. Teams can benchmark performance across cities and countries, identify the sites with the highest potential, and optimise existing locations to capture maximum revenue.
Unmatched spatial detail and accuracy.
Backed by reliable validation methods.
Datasets tailored to client-specific needs.
Ensuring data privacy and protection standards are met.
Beyond Counting: Visitors vs. Passersby
Not every passerby is a potential customer. That’s why Targomo distinguishes between two complementary datasets:
- Footfall: People moving through an area (a measure of exposure);
- Visitors: People who remain in an area for at least five minutes (a measure of engagement).
This distinction between movement and dwell is critical. Visitor data shows how many people spend time in an area daily and what they are there for: shopping, commuting, or leisure. Together, Footfall and Visitor data provide a full picture of both reach and relevance.

Granularity as a Strategic Asset
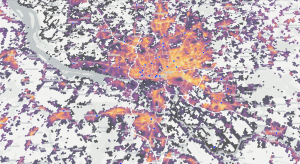
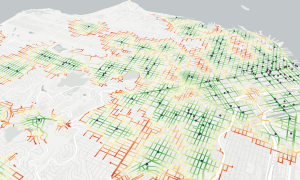
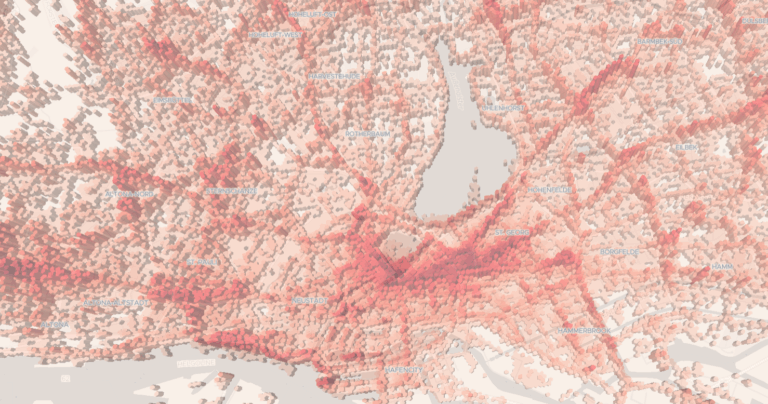
City-wide averages hide the details that determine success. Granularity is Targomo’s key advantage. The hexagonal grid measures pedestrian flows at 28 metres for Footfall counts, and at just 4 metres for the Footfall Index. This ultra-high resolution is unmatched in the market. For more precision, the Footfall Index ranks every cell from 0 to 100, with 100 marking the busiest spot in a country. This makes it possible to:
- Visualise walking paths accurately;
- See the differences between the two sides of the same street;
- Pinpoint the busiest corridors inside a shopping mall;
- Measure traffic directly in front of a specific entrance.

Special Addition: Tourism Analytics
For businesses in seasonal or tourist-heavy markets, Targomo extends its analysis with Tourism Footfall Data. By combining booking platform data, official tourism statistics, and pedestrian flows, the dataset distinguishes tourists from locals. This segmentation enables businesses to match location strategy to audience composition. A premium café may succeed in a tourist corridor, while a grocery chain benefits more from local commuter flows.

Why Expansion Leaders Choose Targomo
One common concern with pedestrian mobility data is reliability. To address this, Targomo’s Foot Traffic data is:
- Validated against laser pedestrian counters
- Cross-checked with manual street counts
- Compared with the mall operators’ official visitor reports
The results consistently show very high correlation across daily totals, seasonal variations, and even hourly peaks. This means expansion teams don’t have to trust our data blindly. Instead, they receive a dataset that has been benchmarked against established data sources
The trustworthy insights are then easily translated into strategy:
- Retail chains can benchmark candidate sites against their strongest performers with the highest footfall counts.
- Restaurants can plan staffing and opening hours around measured demand peaks.
- Gyms and fitness centres can size up the true daytime population, focusing on areas with sustained presence rather than passing flows.
Conclusion: Expansion with Confidence
Footfall data isn’t just a nice-to-have; it is the difference between opening in the wrong location and unlocking sustainable growth. With Targomo’s Foot Traffic data, expansion teams in retail, restaurant, and fitness can make location decisions that are both data-driven and customer-centric. The result? Smarter site selection, optimised operations, and a competitive edge in today’s high-stakes expansion landscape.