


Global Data. Local Insights. Smart Decisions.
Make better business decisions with our library of more than 250 geospatial datasets. Purchase and access data via TargomoLOOP, TargomoAPI, or as direct GIS-ready files. Explore socio-economic indicators, consumer segments, foot traffic, and more. All in one platform, at a global scale.


- 1. Socio-Demographic Data
- 2. Foot Traffic Data
- 3. Vehicle Traffic Data
- 4. Points of Interest (POI)
- 5. CASAFARI Real Estate Data
- 6. Domain-Specific Data
- 7. Your Business Data
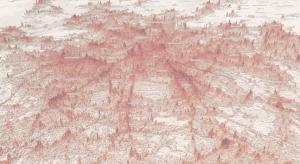
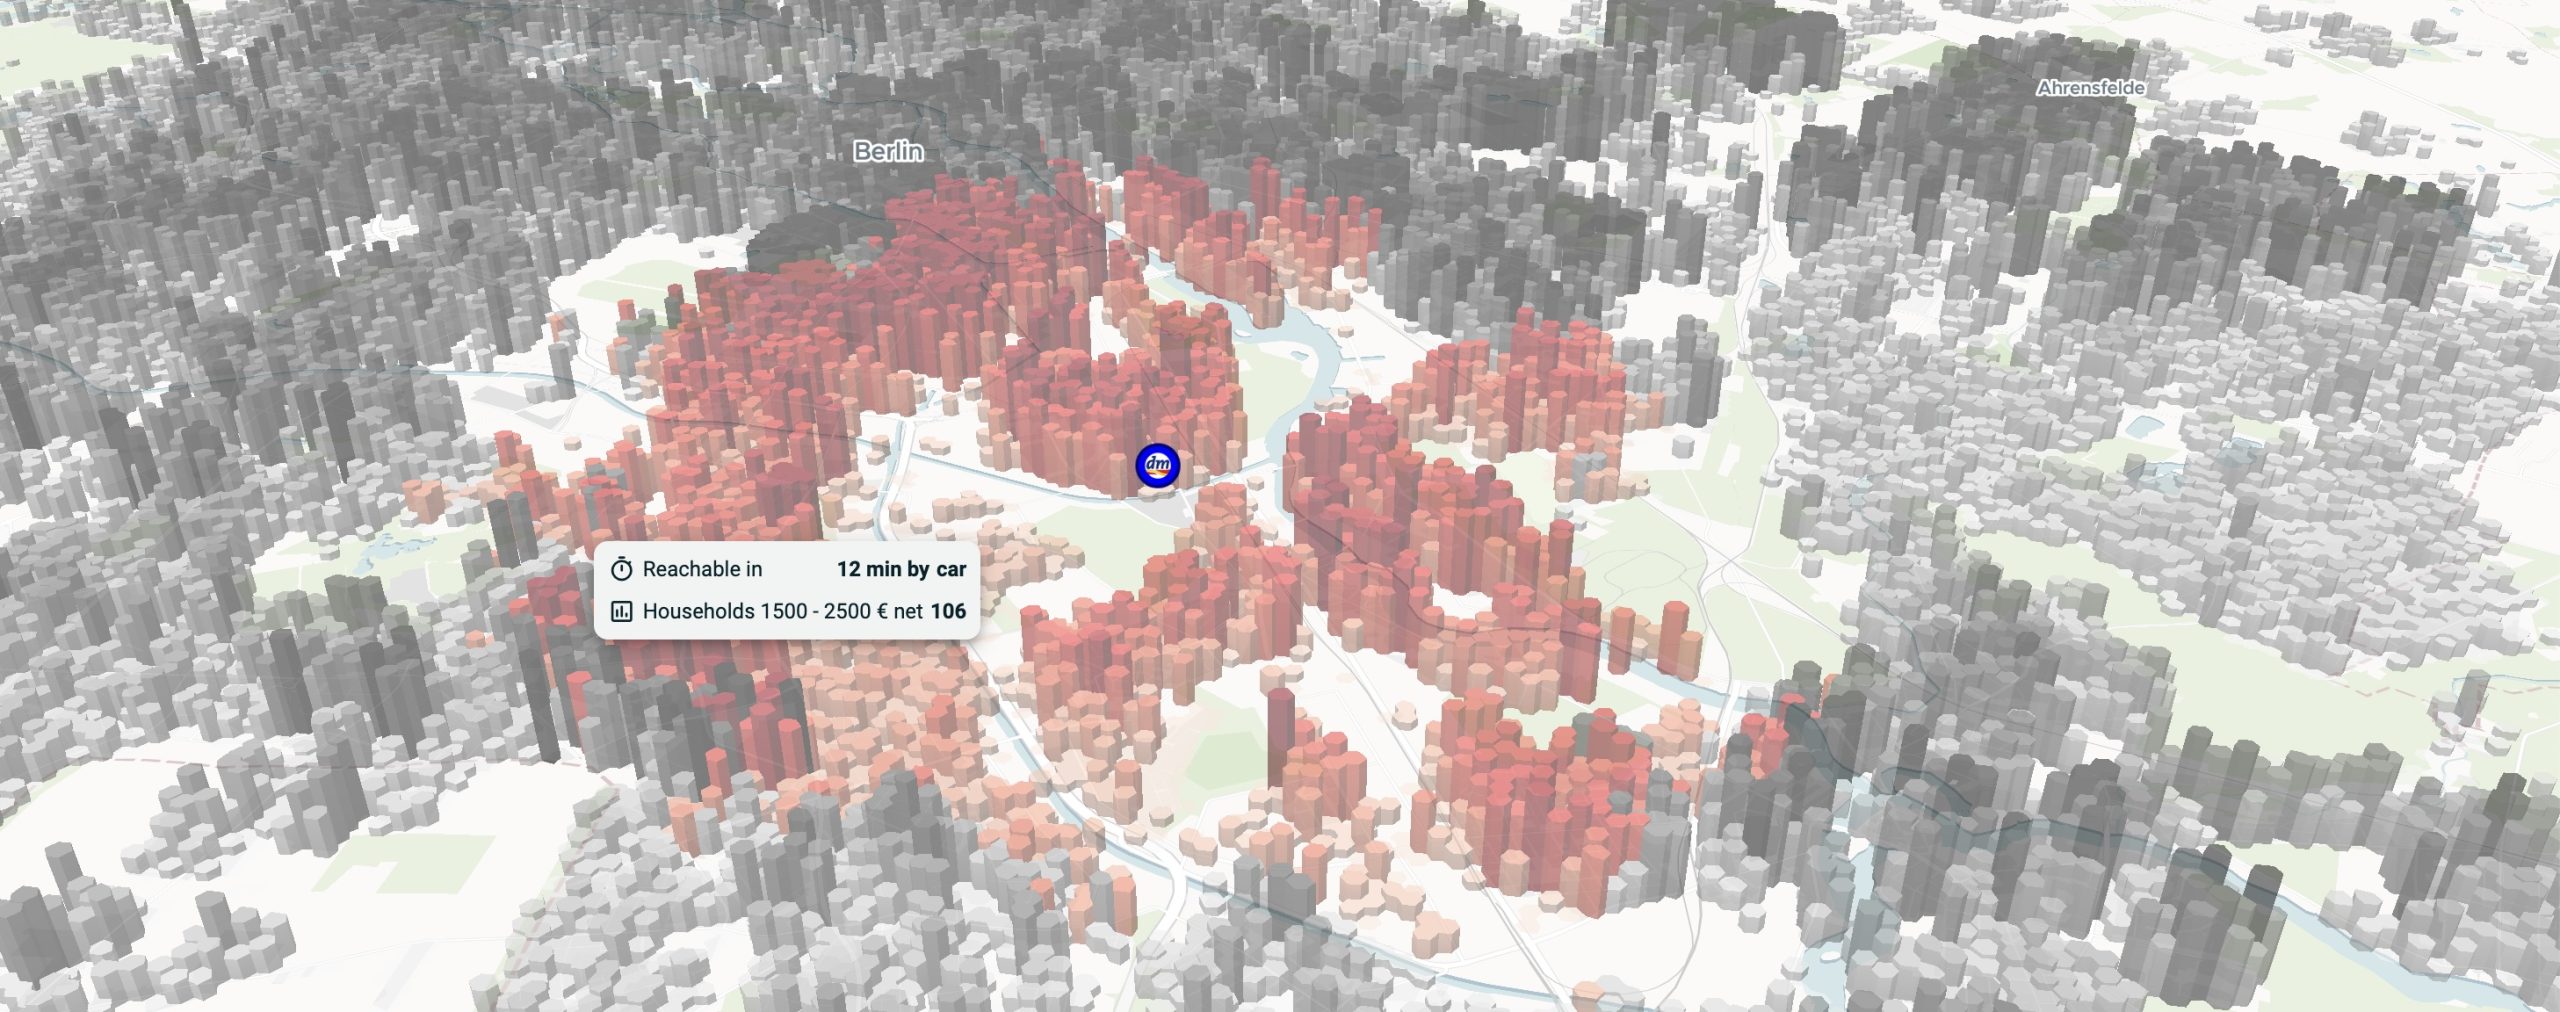
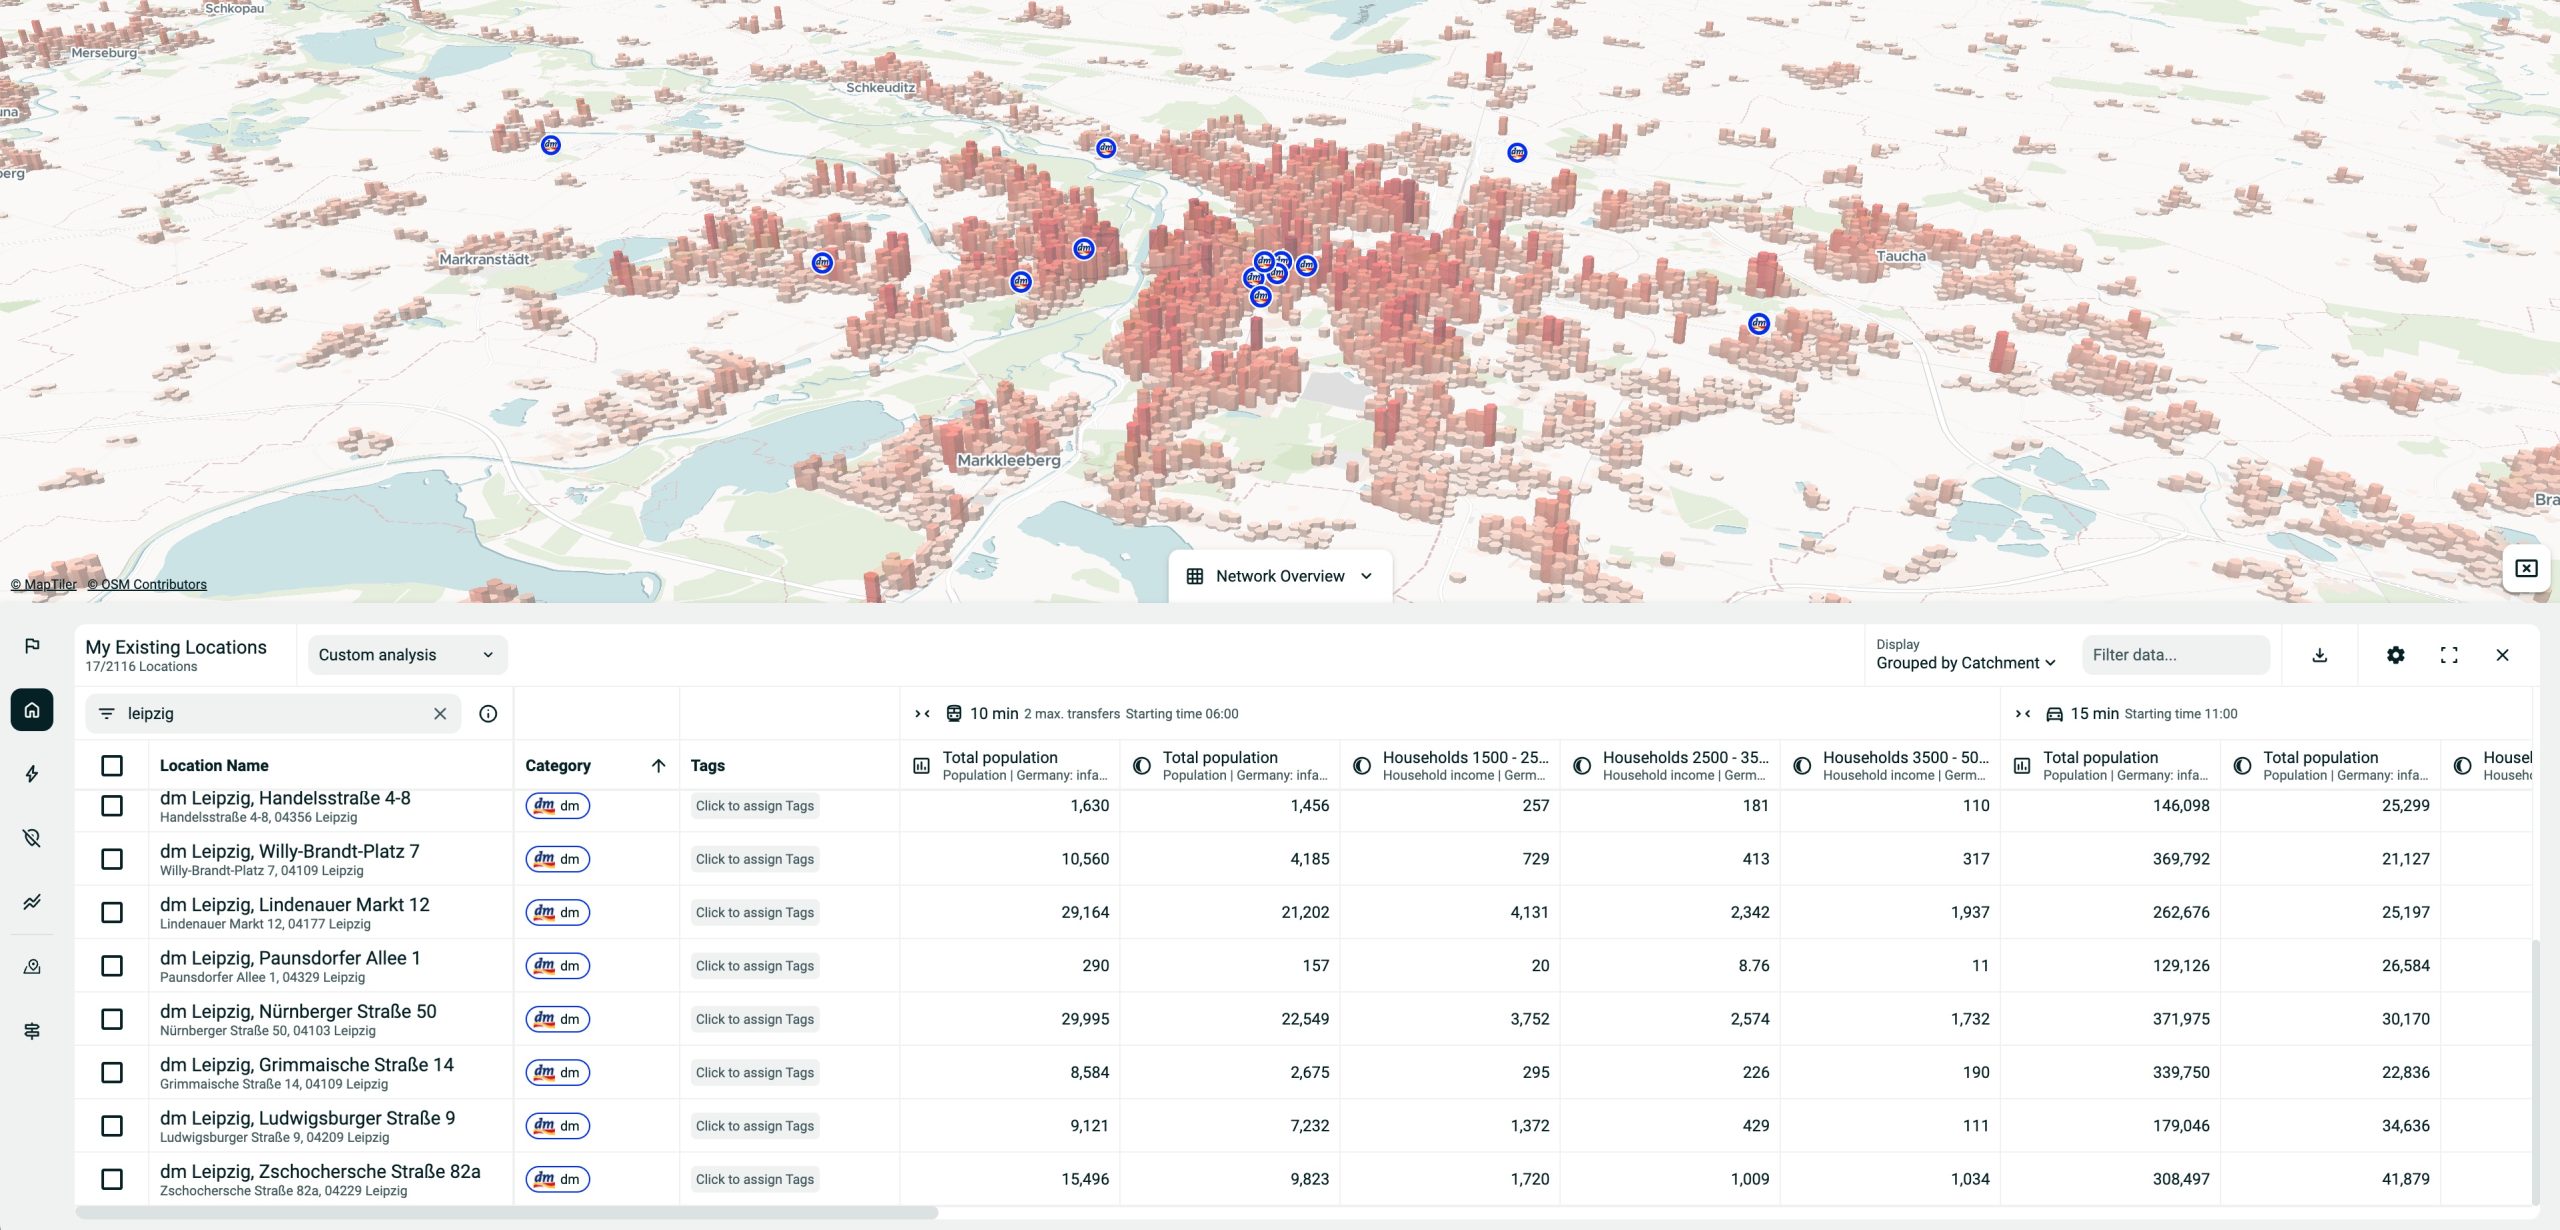
Understand the communities you serve with socio-demographic data. Gain insights into population structures, household characteristics, and economic indicators to support smarter business decisions.
This data is delivered in ~100m grid cells (often based on H3geo.org), enabling international comparisons and consistent analysis across markets. Each cell reflects the characteristics of the local population, offering a clear view of cities, regions, or suburbs.
- Site Selection: Plan locations for demand-sensitive services such as grocery stores and healthcare providers.
- Delivery Services: Optimise delivery zones, enhance offerings, and forecast performance.
- Localised Retail Strategies: Adjust layouts, pricing, and product mix based on community profiles.
- Strategic Expansion: Combine socio-demographic data with reachability or catchment analysis to identify underserved areas or prioritise investments.
- Population data (total, by age/sex, forecast)
- Household characteristics (type, size, income)
- Education levels and psychographics
- Spending power and income distribution
- Housing details (dwelling type, size, ownership)
- Car ownership and commute patterns
- Ethnicity, nationality, language, religion, marital status
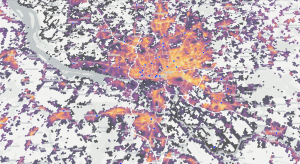
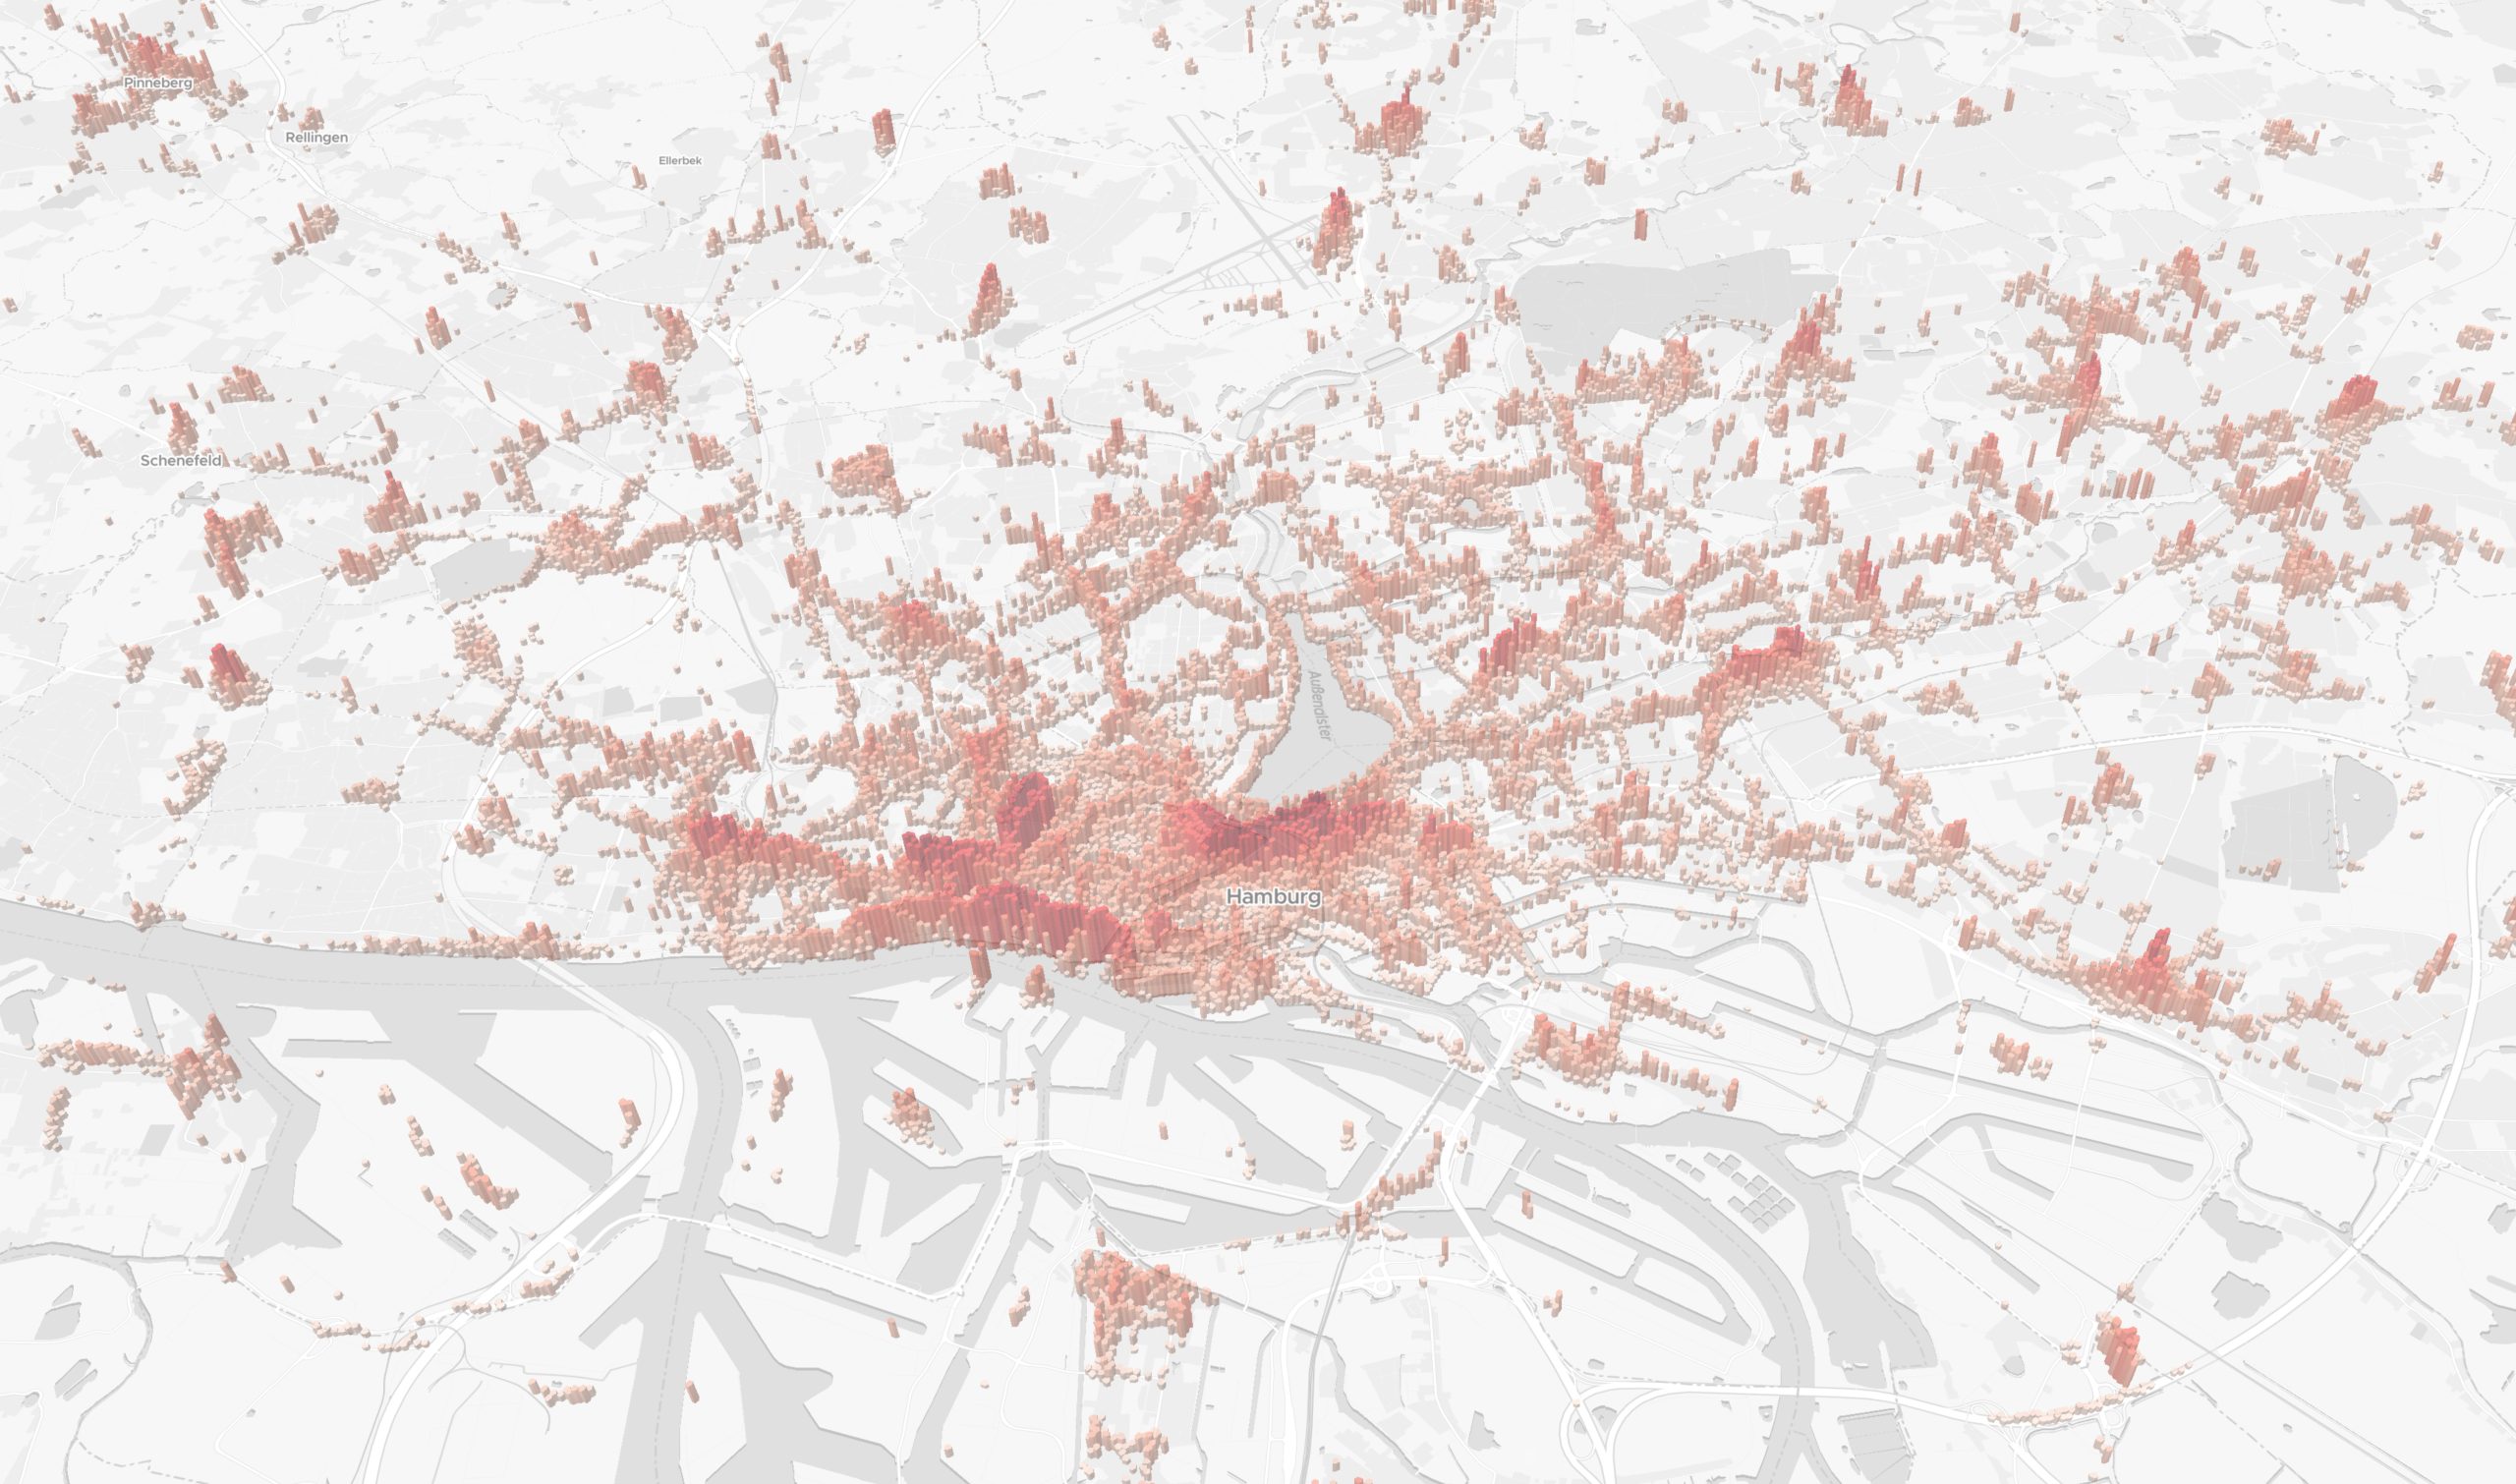
Use footfall data to make smarter decisions about existing and potential locations. This data shows how pedestrians move in specific areas, helping you assess visibility and customer flow.
Collected from anonymised mobile devices, the foot traffic data includes two types of insights. First, absolute footfall and staypoints show how many people pass through and where they tend to stop for more than five minutes. Second, a footfall index reveals the relative busyness of different areas. This data is available in high-resolution grids, down to four meters in dense urban zones.
- Site Selection: Choose locations with strong foot traffic to boost visibility and walk-in potential.
- Marketing Strategies: Time campaigns to match peak pedestrian flows by hour, day, or season.
- Hotspots Analysis: Find the areas with the highest footfall, such as streets, corners or mall sections, to prioritise investments or store placements.
- Cross-Region Analysis: Compare traffic patterns across cities and countries to guide national or multi-market strategies.
- Footfall Counts (general and time-based: hourly, weekly, monthly)
- Footfall Index (normalised score from 0–100, indicating relative traffic volume)
- Visitors (where people stop for more than 5 minutes)
- Visitor profiles
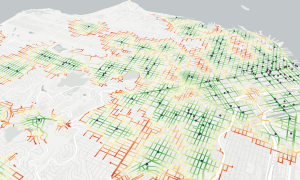
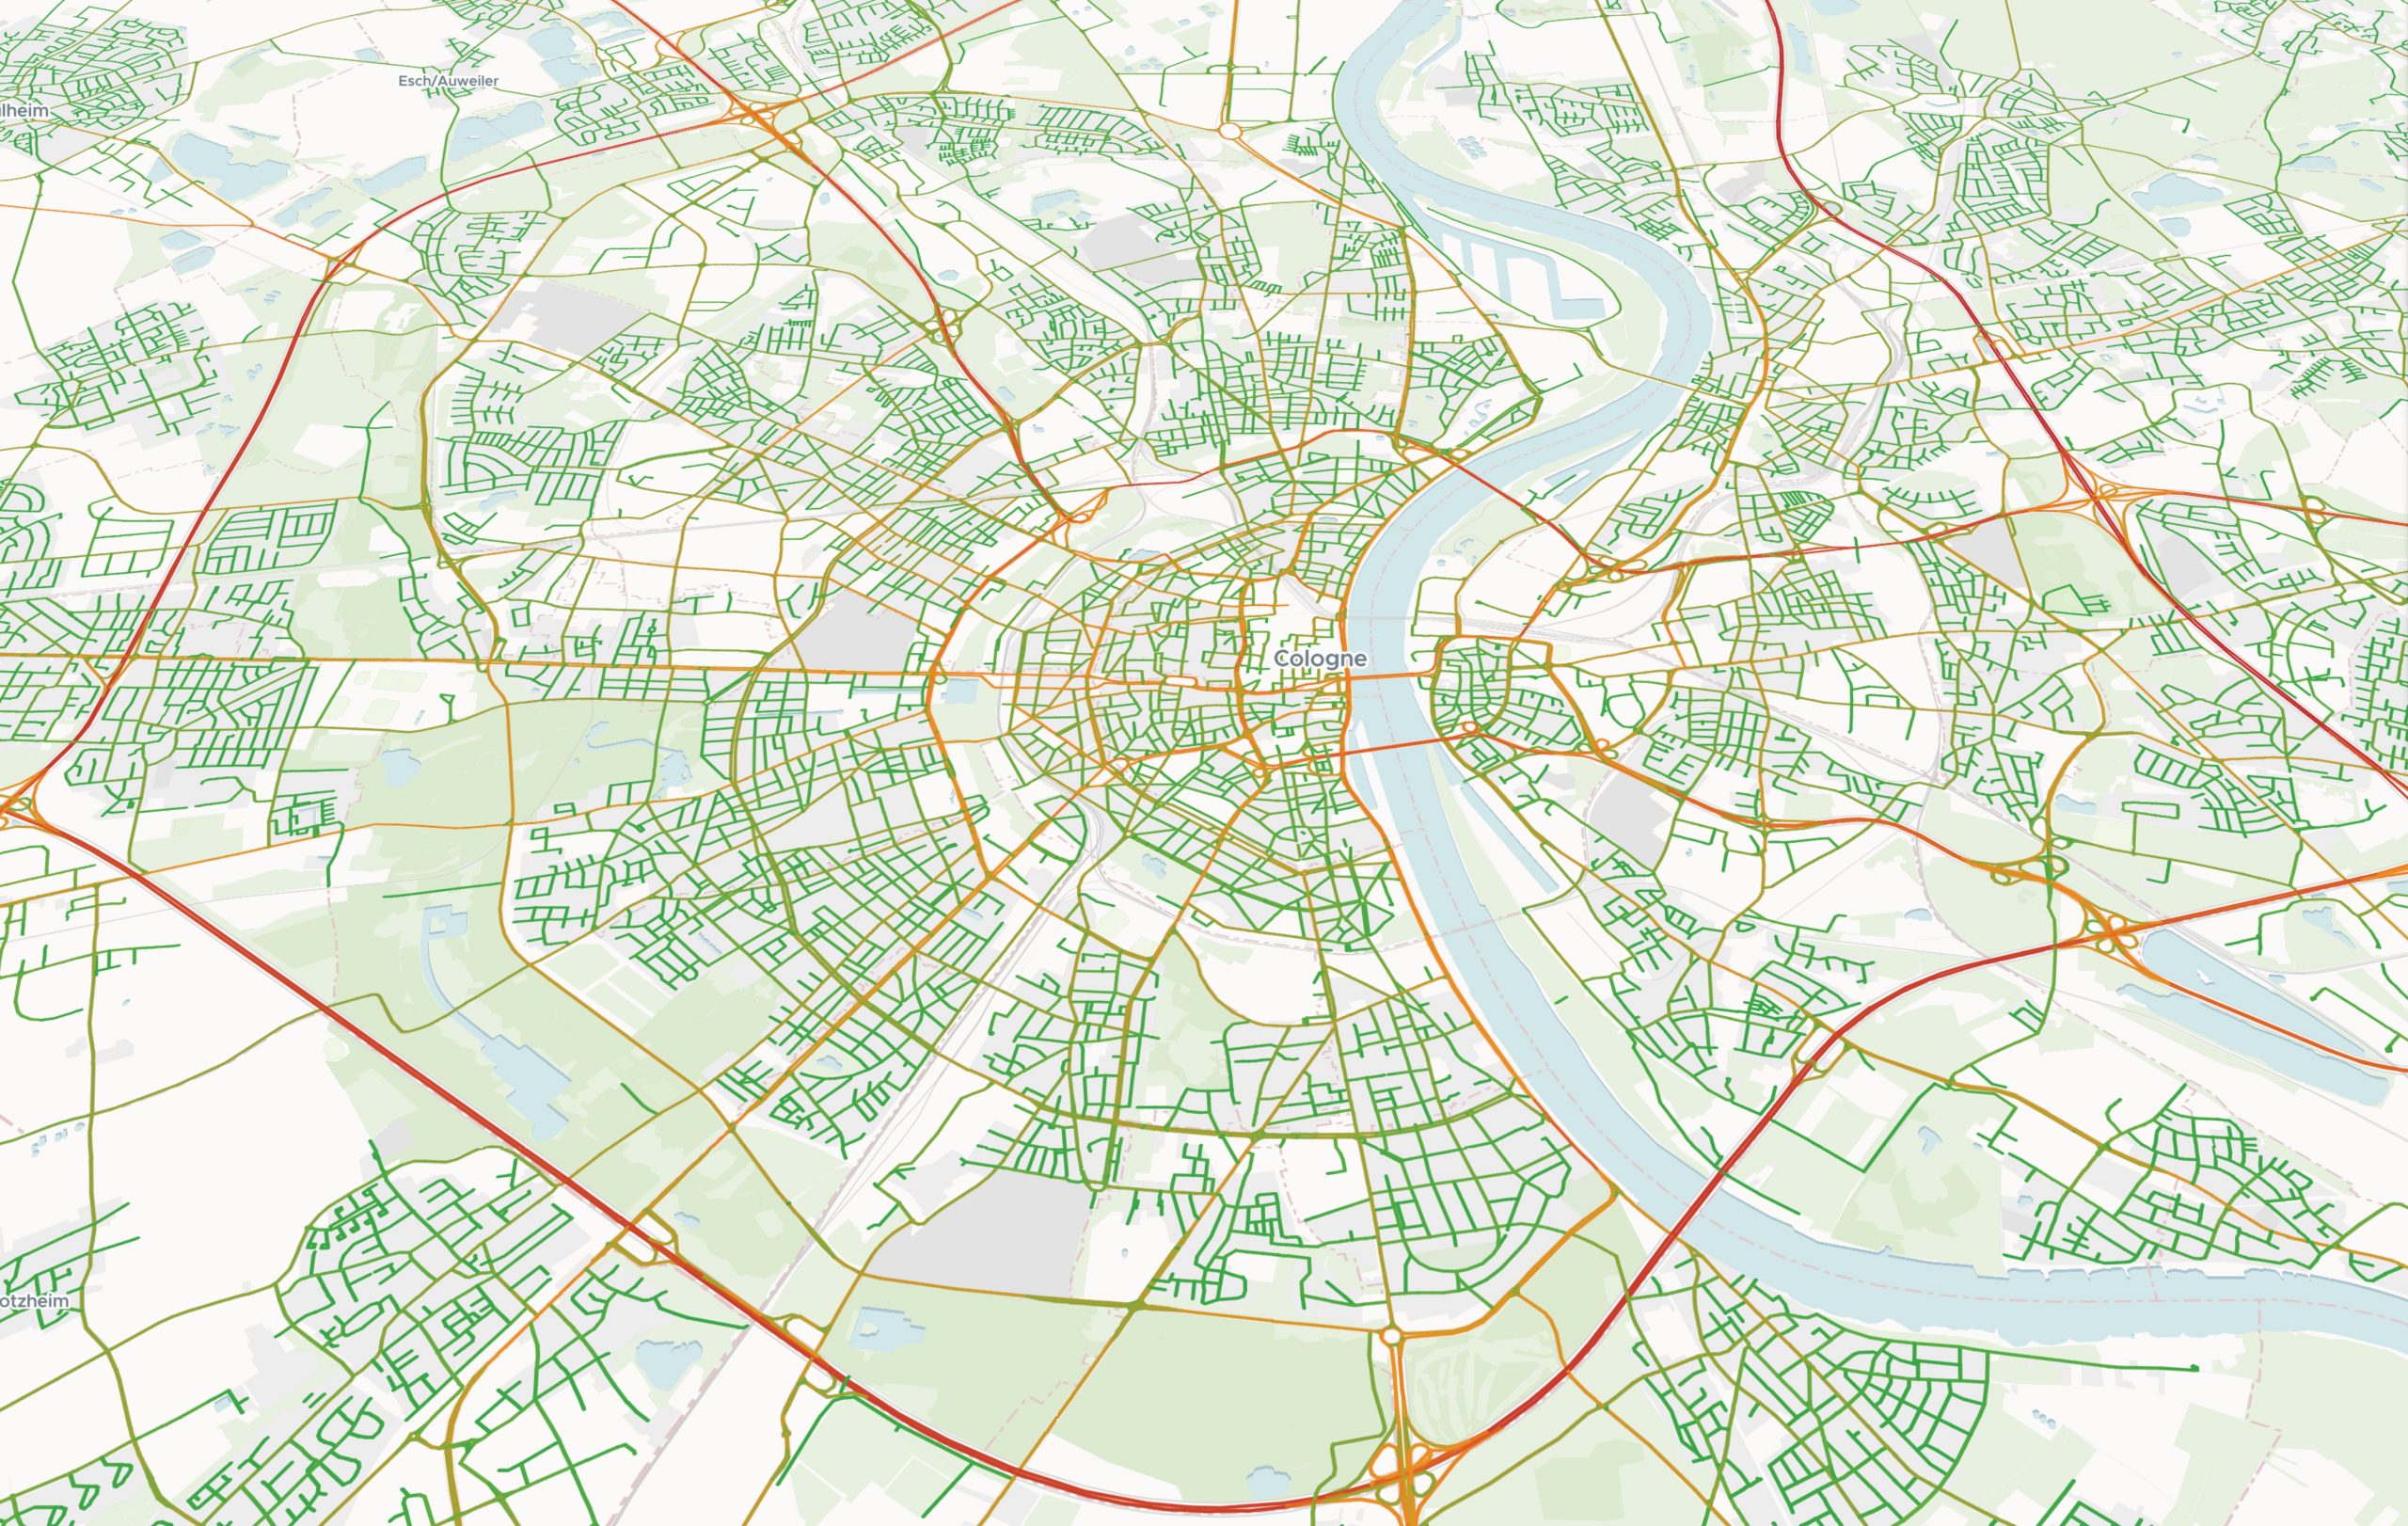
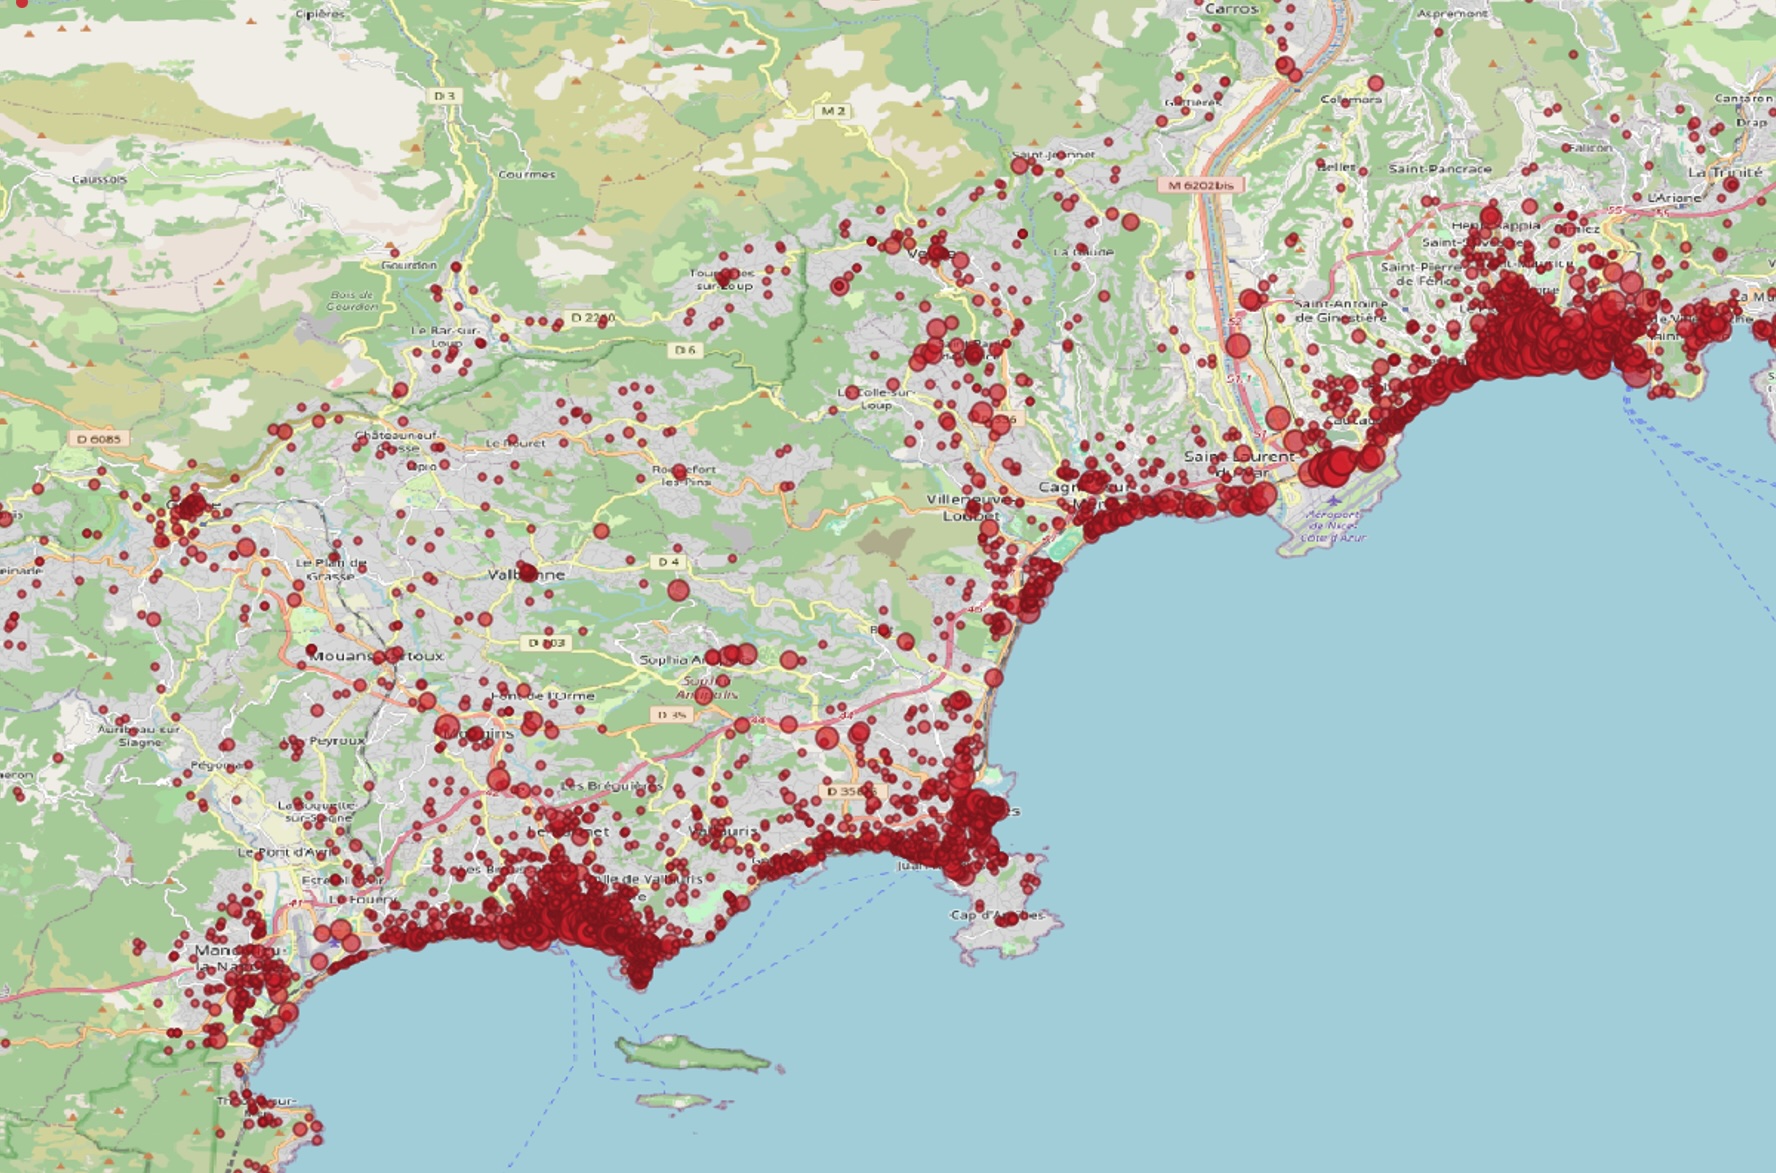
Use vehicle traffic datato understand how many cars pass a specific location or area. This data provides an accurate overview of vehicular movement, measuring absolute vehicle counts, AADT data, and speeds along road segments (edges).
It also includes insights into trip lengths, distinguishing between short commutes and long-distance journeys. Parking events are also covered, offering a unique view of parking behaviour in key areas. Car traffic data can be segmented by road type to better understand how different routes are used.
- Site Planning: Spot high-traffic routes for petrol stations, EV charging points, and roadside businesses.
- Catchment Analysis: Measure vehicle flow through a defined area to estimate customer reach and potential.
- Trip-Based Targeting: Tailor services or campaigns to commuters or long-distance travelers.
- Parking Patterns: Analyse parking behaviour to plan around dwell time, turnover, or service availability.
- Vehicle volumes and traffic speed (by hour, day, week, and weekday/weekend)
- Parking events
- Trip length distribution
- Traffic speeds
- Road type classification (motorway, primary, secondary)
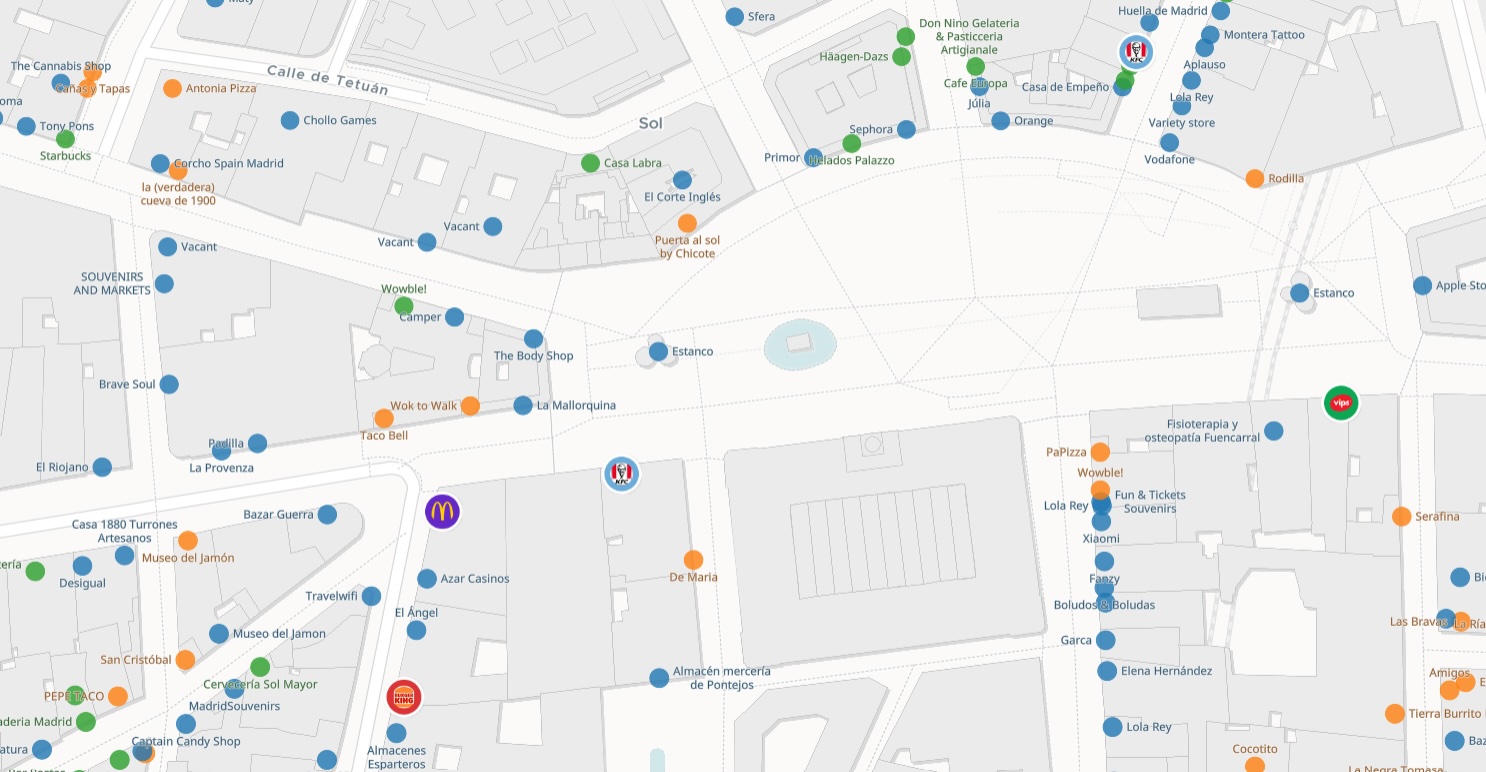
Refine your business strategy with POI data that shows key locations such as competitor sites, amenities, and landmarks. This helps you identify opportunities, spot gaps in the local area, and stay ahead of the competition.
Our Points of Interest data comes from trusted providers like OpenStreetMap and specialised data partners. It is continuously updated to ensure accuracy and relevance. We also offer custom POI sourcing to meet specific industry or client needs.
- Site Selection: Identify optimal locations near key POIs like supermarkets, schools, or transit hubs. This is especially useful for industries that benefit from proximity, such as fashion or gastronomy.
- Competitor Analysis: Map competitor sites to understand the local landscape and evaluate saturation.
- Local Area Profiling: Categorise neighbourhoods into “shopping,” “eat-out,” or other districts to inform business strategy.
- Types: Retail stores, restaurants, gyms, entertainment venues, and more.
- Brands: Global and regional brands such as McDonald’s, IKEA, and Aldi.
- Custom Sourcing: Tailored POI data to support specific use cases, including competitive or complementary businesses.
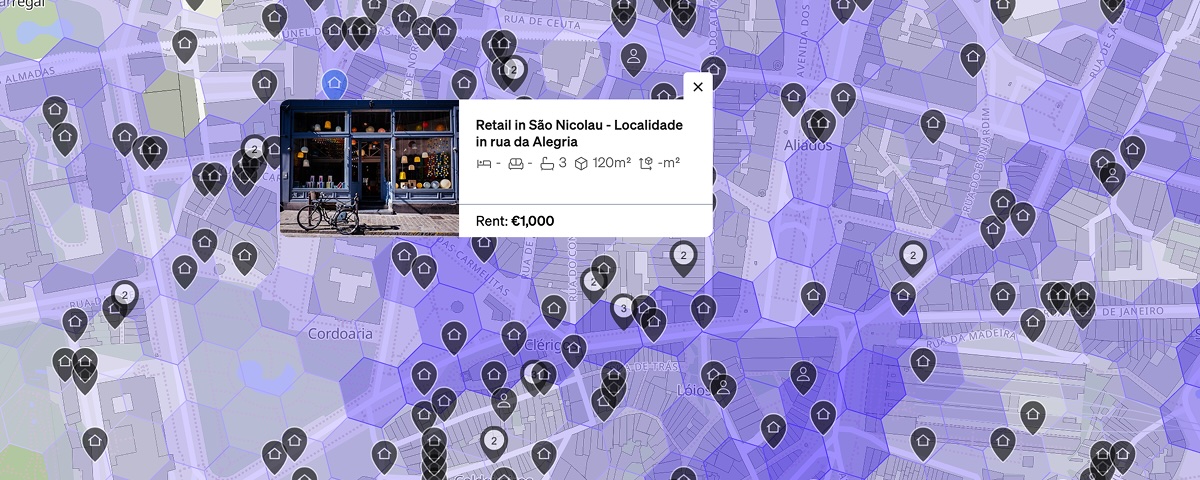
CASAFARI is a leading real estate solution that connects 60,000 professionals through innovative data and collaboration tools. With proprietary technology, CASAFARI indexes, aggregates, and analyses more than 50 million unique properties from 30.000 sources. It provides tools for property history, sourcing, valuation, market analytics, reports, APIs, and CRM. These solutions serve top brands in the European real estate market.
Find the next place to expand your business with CASAFARI’s complete market vision.
- Get full market visibility across properties and trends
- Filter properties using 30+ attributes to match your needs
- View full property history to support better negotiations
- Access accurate, market-based property valuations
- Receive alerts when saved properties are updated
- Delivered through easy-to-use tools
- Cleaned and standardised for accuracy
- Updated in real-time
- Organised into actionable insights
Gain a competitive edge with geospatioal datasets tailored to your industry. Whether your business is dependent on tourism, real estate, hospitality, or another specialised field, our data solutions offer precise insights to help you succeed.
We source and curate domain-specific datasets, including tourism analytics data to support your strategic priorities. These insights help you solve unique challenges, uncover new opportunities, and stay ahead of the competition.
- Unique Industry Insights: Access data from sectors like tourism, real estate, or hospitality.
- Tailored Solutions: Solve niche challenges with data curated for your business.
- Custom Scoring for Expansion: Combine multiple datasets into a single score based on your success factors to identify areas for growth.
- Overnight stays (origins, prices, and more)
- Train stations (departure volumes by transport mode)
- Sector-specific and experimental datasets tailored to unique business cases
Maximise the value of your own business data by integrating it with TargomoLOOP. Combined with geospatial insights, this unlocks clearer, more confident decision-making.
Whether it is sales performance, customer feedback, or store metrics, your data becomes more powerful when analysed alongside location intelligence. This integration enables advanced applications like GeoAI and correlation analysis to optimise operations, refine strategies, and reveal new growth opportunities.
- Enhanced Forecasting: Use GeoAI to forecast revenue for new sites by integrating sales and customer data.
- Targeted Marketing: Personalise campaigns based on customer and location insights.
- Success Driver Analysis: Understand what contributes most to strong performance.
- Site Performance Evaluation: Identify over- and underperforming sites to focus on improvements and strengthen your network.
- Sales performance and customer data
- Store locations and operational metrics
- Store types and service categories
- Customer distribution by residential location.
Visit our Data Explorer for the full list of geospatial datasets or contact us to uncover the insights you need.