
Targomo Launches Free-to-use Version of its Location Optimization Platform
Make in-depth analyses of locations and their surroundings with Targomo’s new service, a fast and easy-to-use platform to calculate catchment areas with demographic, movement and points-of-interest data.
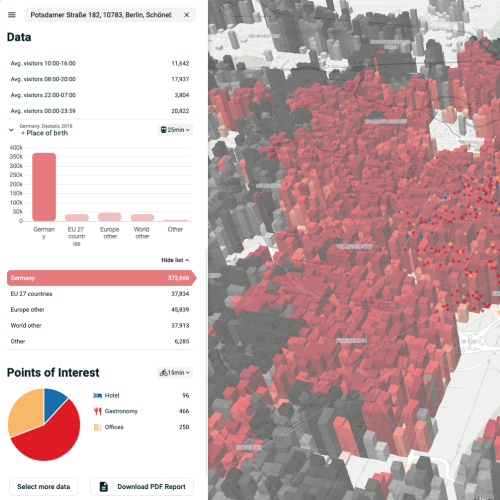
Targomo’s location analytics platform easily calculates and visualizes how many people you can reach with your store, your restaurant or your office, for instance.
The new version of Targomo’s of location optimization platform (LOOP), free of charge, is available in beta mode and allows users to quickly gain insights about one of the most important business assets: locations. Within seconds, users can calculate the catchment area of branches with demographic, movement and points-of-interest (POI) data.
Many businesses and organizations, from retail to hospitality, from real estate to mobility and public services, can benefit from TargomoLOOP by making detailed analyses of how many people and which kind of customers they can reach with their locations.
“Location data and location intelligence have such a great potential to improve operations and people’s daily lives,” says Patrick Schoenemann, Targomo’s CEO. “But until now the entry barriers were too high for most organizations and people. Targomo wants to change this and make location intelligence accessible to everyone. That’s why we’ve launched a new version of our location intelligence platform that allows everyone to easily gain valuable insights. They only need to sign in, type in an address – and that’s it!”
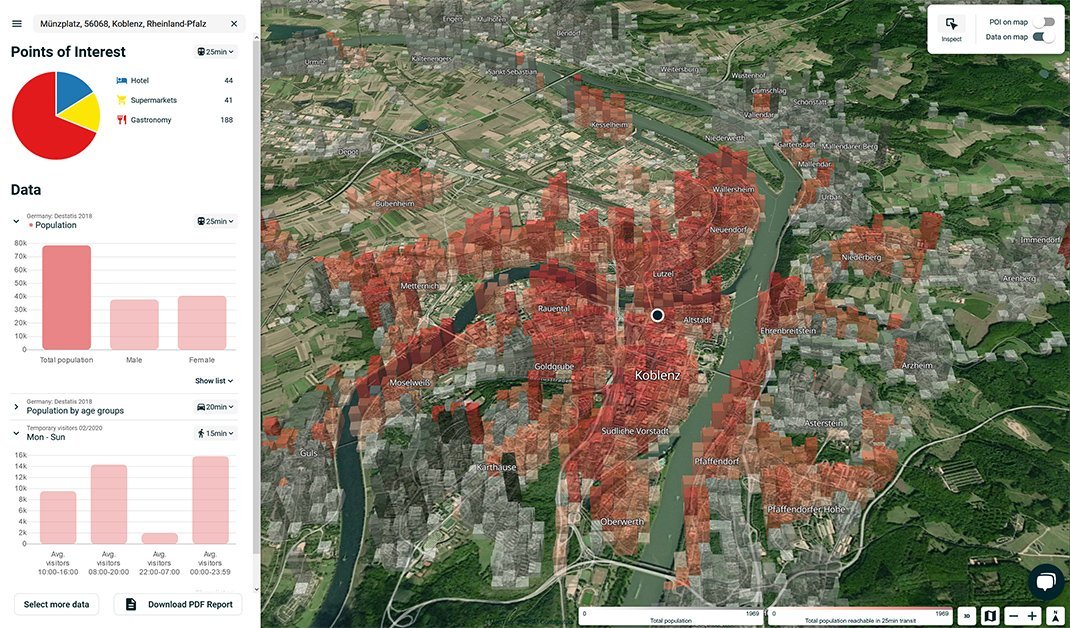
The free-to-use version of TargomoLOOP offers all essential data to analyze locations, starting with maps (OpenStreetMap), demographics, Points of Interest and movement data, which shows the frequency of visitors in an area. Users can analyze an unlimited number of locations.
Key features
- Fast and easy: All the essential location data on a fast and easy-to-use platform. Free of charge.
- In-depth analysis: Use demographics, POI and movement data to fully understand your location, its trade area and its click-and-collect potential.
- Catchment area: Easily calculate catchment areas. Learn how many and which kind of people can reach your locations
- Essential data: statistics about the population, country of birth, housing, household size, age groups, movement data (visitor frequency), points of interest (such as restaurants, supermarkets, public transport stops, hotels, etc.)
- Powerful reports: Share your location insights with powerful visualizations and reports to convince stakeholders
Businesses that would like to access more data sources – such as the full set of visitor data (movement data), household income groups, consumer profiles and of other countries – or use customized services, such as revenue prediction, can contact us to learn more about our enterprise solution.
Tailormade features (requires a customized setup and comes in addition to TargomoLOOP)
- Revenue prediction: By including proprietary data and using machine learning technologies, we can identify the factors that drive the performance of your locations. Use these insights to predict sales of potentially new locations, and replicate your successes across the network.
- Assortment optimization: Boost sales by adapting your assortment to local tastes. Consumer profiles and spending power data allows for a targeted approach to market products.
- Competition analysis: With the help of gravitational models, anticipate how competitors and your own network will affect visitor numbers and overall performance. Identify locations with the most potential and determine whether and how relocation could improve your market penetration.
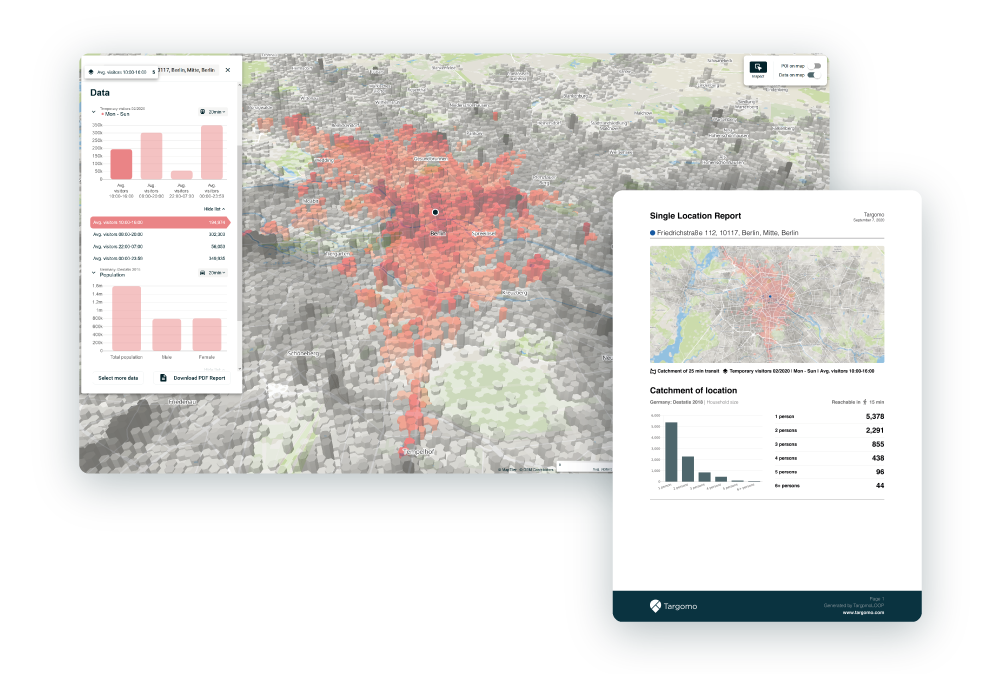
TargomoLOOP generates insights for different demographic groups, and takes different transportation means and travel times into account. Users can download the results as a PDF document.