


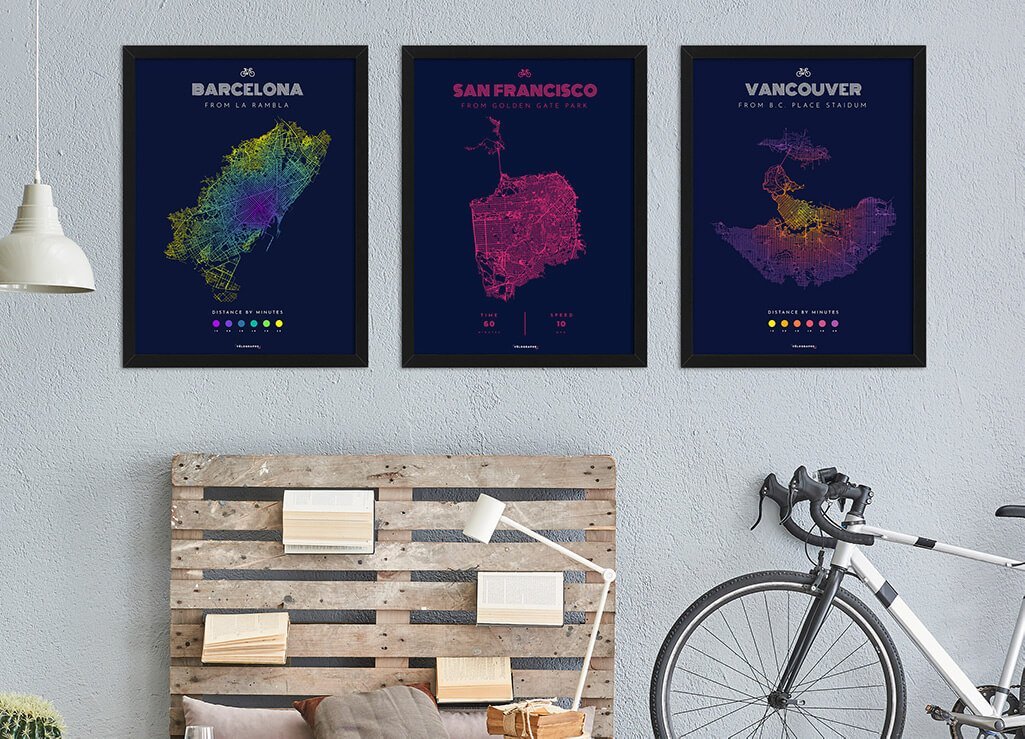
Like so many of us, Ryan Morris loves to travel, especially by bike. The France-based American found a way to turn his passion into a beautiful work of art, using location technology to showcase reachable areas by bike. His idea comes with a twist: In his online shop Vélographs, customers can select any location of their choice and order a poster-size print of a unique bike map in the blink of an eye. For these live travel time calculations, the Vélographs project relies on Targomo’s API.
Ryan, you are a marketing expert with a strong design focus. Your work usually revolves around web projects. Why did you go for travel maps?
Before starting a career, I spent about four years travelling the world and living out of a backpack. While traveling by bus across large countries like South Africa and Argentina, I became obsessed with maps – this was before smartphones were available, so on long rides often it was just maps of where I was heading to keep me company. And maps, whether analog or digital, will always be key to knowing what’s possible and what’s accessible. Taking a chance on a new place and not knowing anything about it except where it is on the map, that was kind of fundamental to me.
How are your maps different?
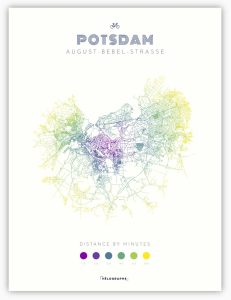
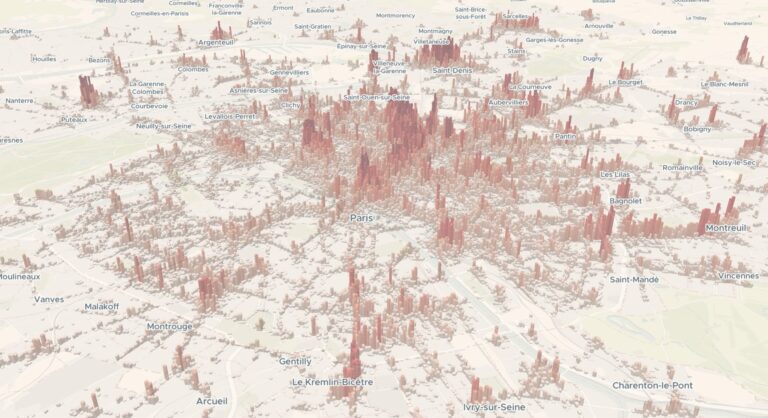
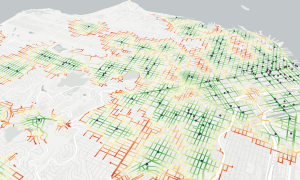
The maps that are created by Vélographs are truly unique – yes because they are personalized, but even more so because of their concept: It’s topography by subtraction. That idea fascinates me. A traditional map will show you everything, and you have to discern where you can get to and what might be in the way. A Vélograph only shows areas reachable within a 60 minute bike ride, natural obstacles such as mountains and rivers are subtracted from the topography, resulting in your actual cycling range and all your biking possibilities. Even traffic patterns and elevations are represented within these calculations. This can lead to incredibly interesting prints. I also love that it provides a fresh perspective on a place you might know by heart. For example, I looked up the old house I grew up in, and I never would have guessed that is was my childhood home and surrounding area. And to me that was really quite interesting – to know a place inside out and yet not recognize it due to the contours of the area around it.
Your travel time (gradient-colored) maps are calculated live through Targomo’s API. How did you come across location technology?
Living in Grenoble, France, I’m sharing an office with Adam Roberts, who’s taking care of Targomo’s API customer projects. We spent many lunches discussing what was visually possible with location technology, especially travel time analysis. Coming from a background of travel and consumer marketing, I was intrigued by such unique customization and personalization, which was easily unlocked with Targomo.
What was most important in your decision to launch a completely new consumer product?
My personal vision was to enable customized map creation on the front-end, while utilizing automation under the hood, so as the business scaled, it wouldn’t require more overhead. I wanted to prove to myself it was possible.
Also, when it became clear that not only can we determine access for cyclists at a certain speed by time, but we can also color-grade it, that was kind of the aha-moment for me. It’s not just 60 minutes, it’s every 10-minute-span within that hour of riding. I have never seen anything like that.
Which were your biggest challenges with regard to launching this project?
I was mainly concerned about the speed and quality. In e-commerce, speed matters more than anything else. You start to lose customers at a rate that compounds for each second that you make them wait. Whether it’s when they add something to their cart, or the time it takes to load an image, time is of the essence. My biggest doubt was: Can this technology really render a custom map, on the fly, and in high detail at a speed that isn’t going to push people away? And even on a 4G cellphone connection? But Targomo’s API more than exceeded my expectations – Targomo proved it was possible. Then, once I found a print partner for both Europe and North America that could produce our maps at the level of quality and detail we required, then the two big boxes felt like they were checked.
Thank you for the interview!
My pleasure. Thank you Felicia and the team at Targomo.
If you want to use Targomo’s API to create your own, unique applications or location features, have a look at what you can do in our developer center or directly get in touch!
Vielleicht interessiert Sie auch