


For many countries, tourism shapes entire cities. Streets that are full of visitors in July can fall silent in November. For brands in retail, hospitality, or dining, understanding these shifts is critical for making the right expansion decisions.
Targomo’s Tourism Analytics Data reveals where visitors move, where they stay, and how their patterns change over time, giving decision-makers a reliable, data-driven foundation for choosing locations that thrive all year round.
Why Location Intelligence Matters for Tourism-Driven Expansion
For tourist-driven businesses, expansion decisions can no longer rely simply on the busyness of the area. A promising street might host mostly day-trippers; a popular square could attract commuters but not spenders. Without accurate tourist footfall data, businesses risk opening in locations that look vibrant but underperform year-round.
Targomo solves this by merging mobility analytics with official tourism data within our location intelligence platform, showing where tourists actually go, how long they stay, how far they have travelled and more.
What Tourism Analytics Data Is and How It Powers Site Selection
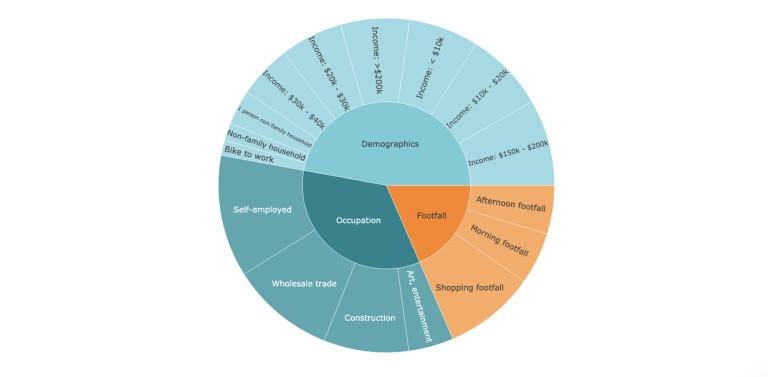
Tourism analytics data integrates verified sources, including pedestrian movement patterns, booking platform data, and official tourism statistics, to show how visitors move through cities and where they stay.
For expansion teams, these insights reveal the real dynamics of tourism-driven demand. Decision-makers can:
- Spot tourist-driven areas and movement patterns
- Compare tourist activity across districts, cities, or countries.
- Analyse where tourists stay overnight and how this connects to nearby businesses.
- Pinpoint the most promising locations for retail, restaurants, and hospitality expansion.
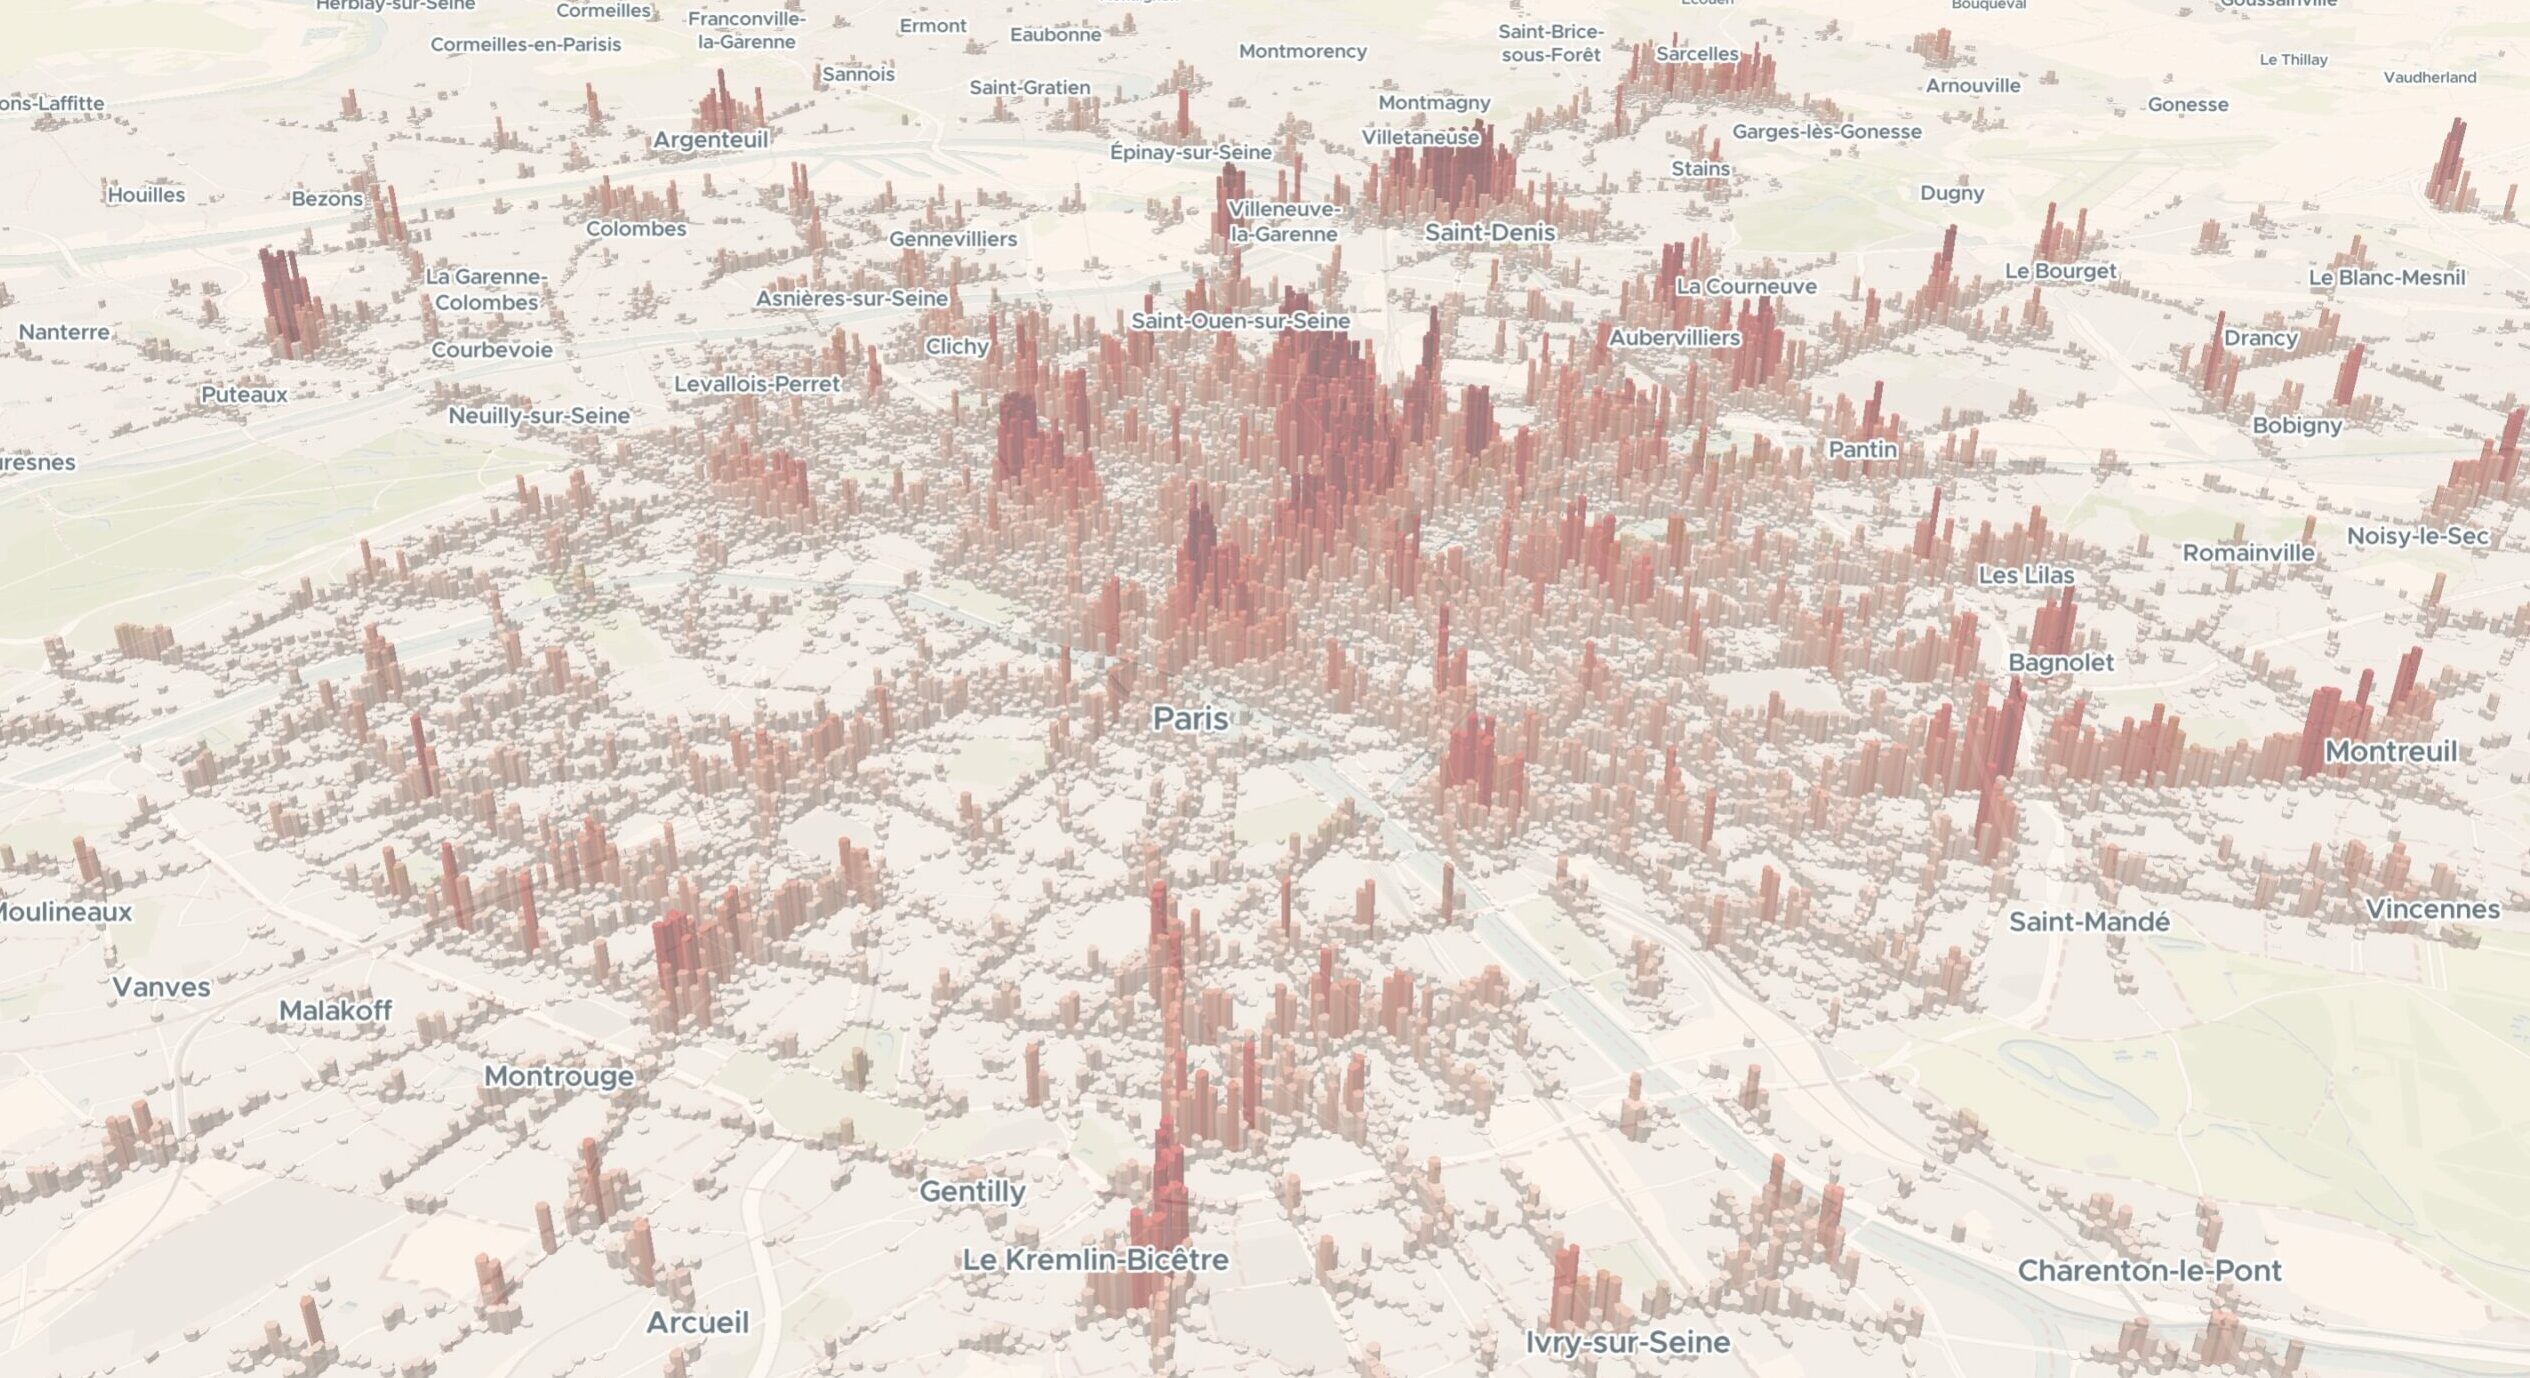
With high resolution of up to 4 metres, Targomo’s Tourism Analytics Data visualises not just the busiest streets, but which side of the street, entrance, or plaza draws the highest concentration of tourists, turning mobility data into actionable location intelligence.
Why Choose Targomo’s Toursim Analytics Data?

Granularity & Precision
Hight accuracy resolution of up to 4 metres.

Proven Accuracy
Backed by reliable validation methods.

Scalable Solutions
Tailored for tourism-driven businesses.

GDPR Compliant
Ensuring data privacy and protection standards are met.
How Targomo’s Tourism Analytics Data Works
Targomo’s Tourism Analytics Data integrates three validated data layers to give a complete, spatially accurate picture of visitor dynamics.
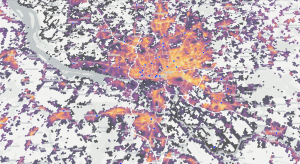
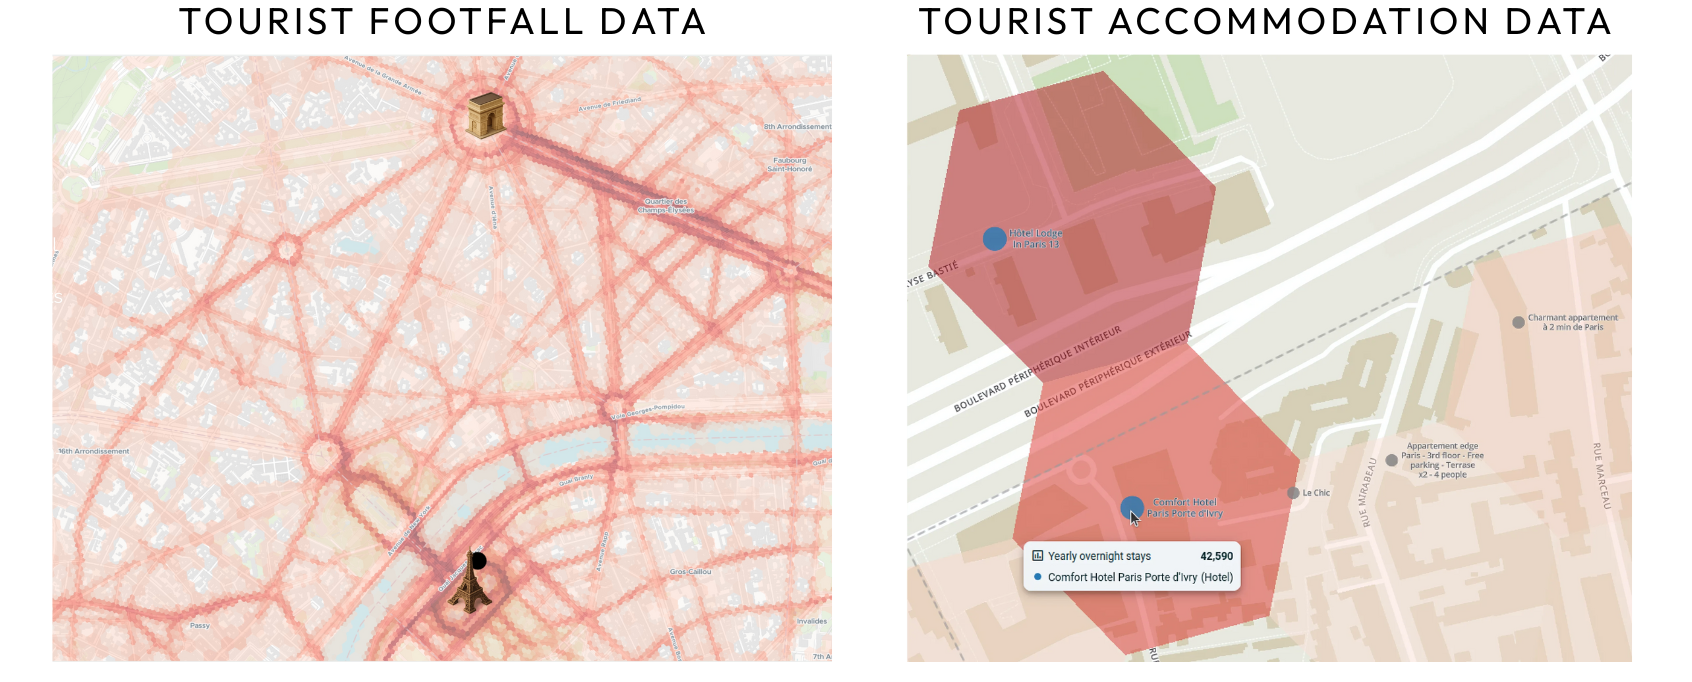
1. Tourist Footfall Data
Tracks pedestrian movement patterns and peak hours, focusing exclusively on tourists by filtering out locals and commuters.
- Identifies high-traffic tourist zones and detailed walking paths.
- Estimates how many tourists pass a specific site or street each day.
- Enables direct comparison of tourist activity across neighbourhoods and cities.
2. Tourist Accommodation Data
Combines booking platform information with official tourism statistics to map where visitors stay.
- Covers hotels, hostels, and short-term rentals.
- Provides accurate guest counts per property, derived from verified data sources.
- Adds behavioural and temporal context by breaking down tourists by month of the visit, nationality, traveller type, and spending tier.
Together, these layers connect where tourists go, where they stay, and how their behaviour changes over time, turning raw mobility data into actionable insights for expansion and market planning.
Using Tourism Analytics Data for Expansion Strategy
Understanding Seasonality and Traveller Spending Patterns
Tourism fluctuates constantly. By analysing guest stays and spending patterns, Targomo helps brands adapt their expansion strategy to data-baked results.
For instance:
- Marbella experiences sharp summer peaks — ideal for luxury retail, beach cafés, and pop-ups.
- Malaga enjoys steady year-round demand — a better fit for mid-market restaurants or grocery stores.
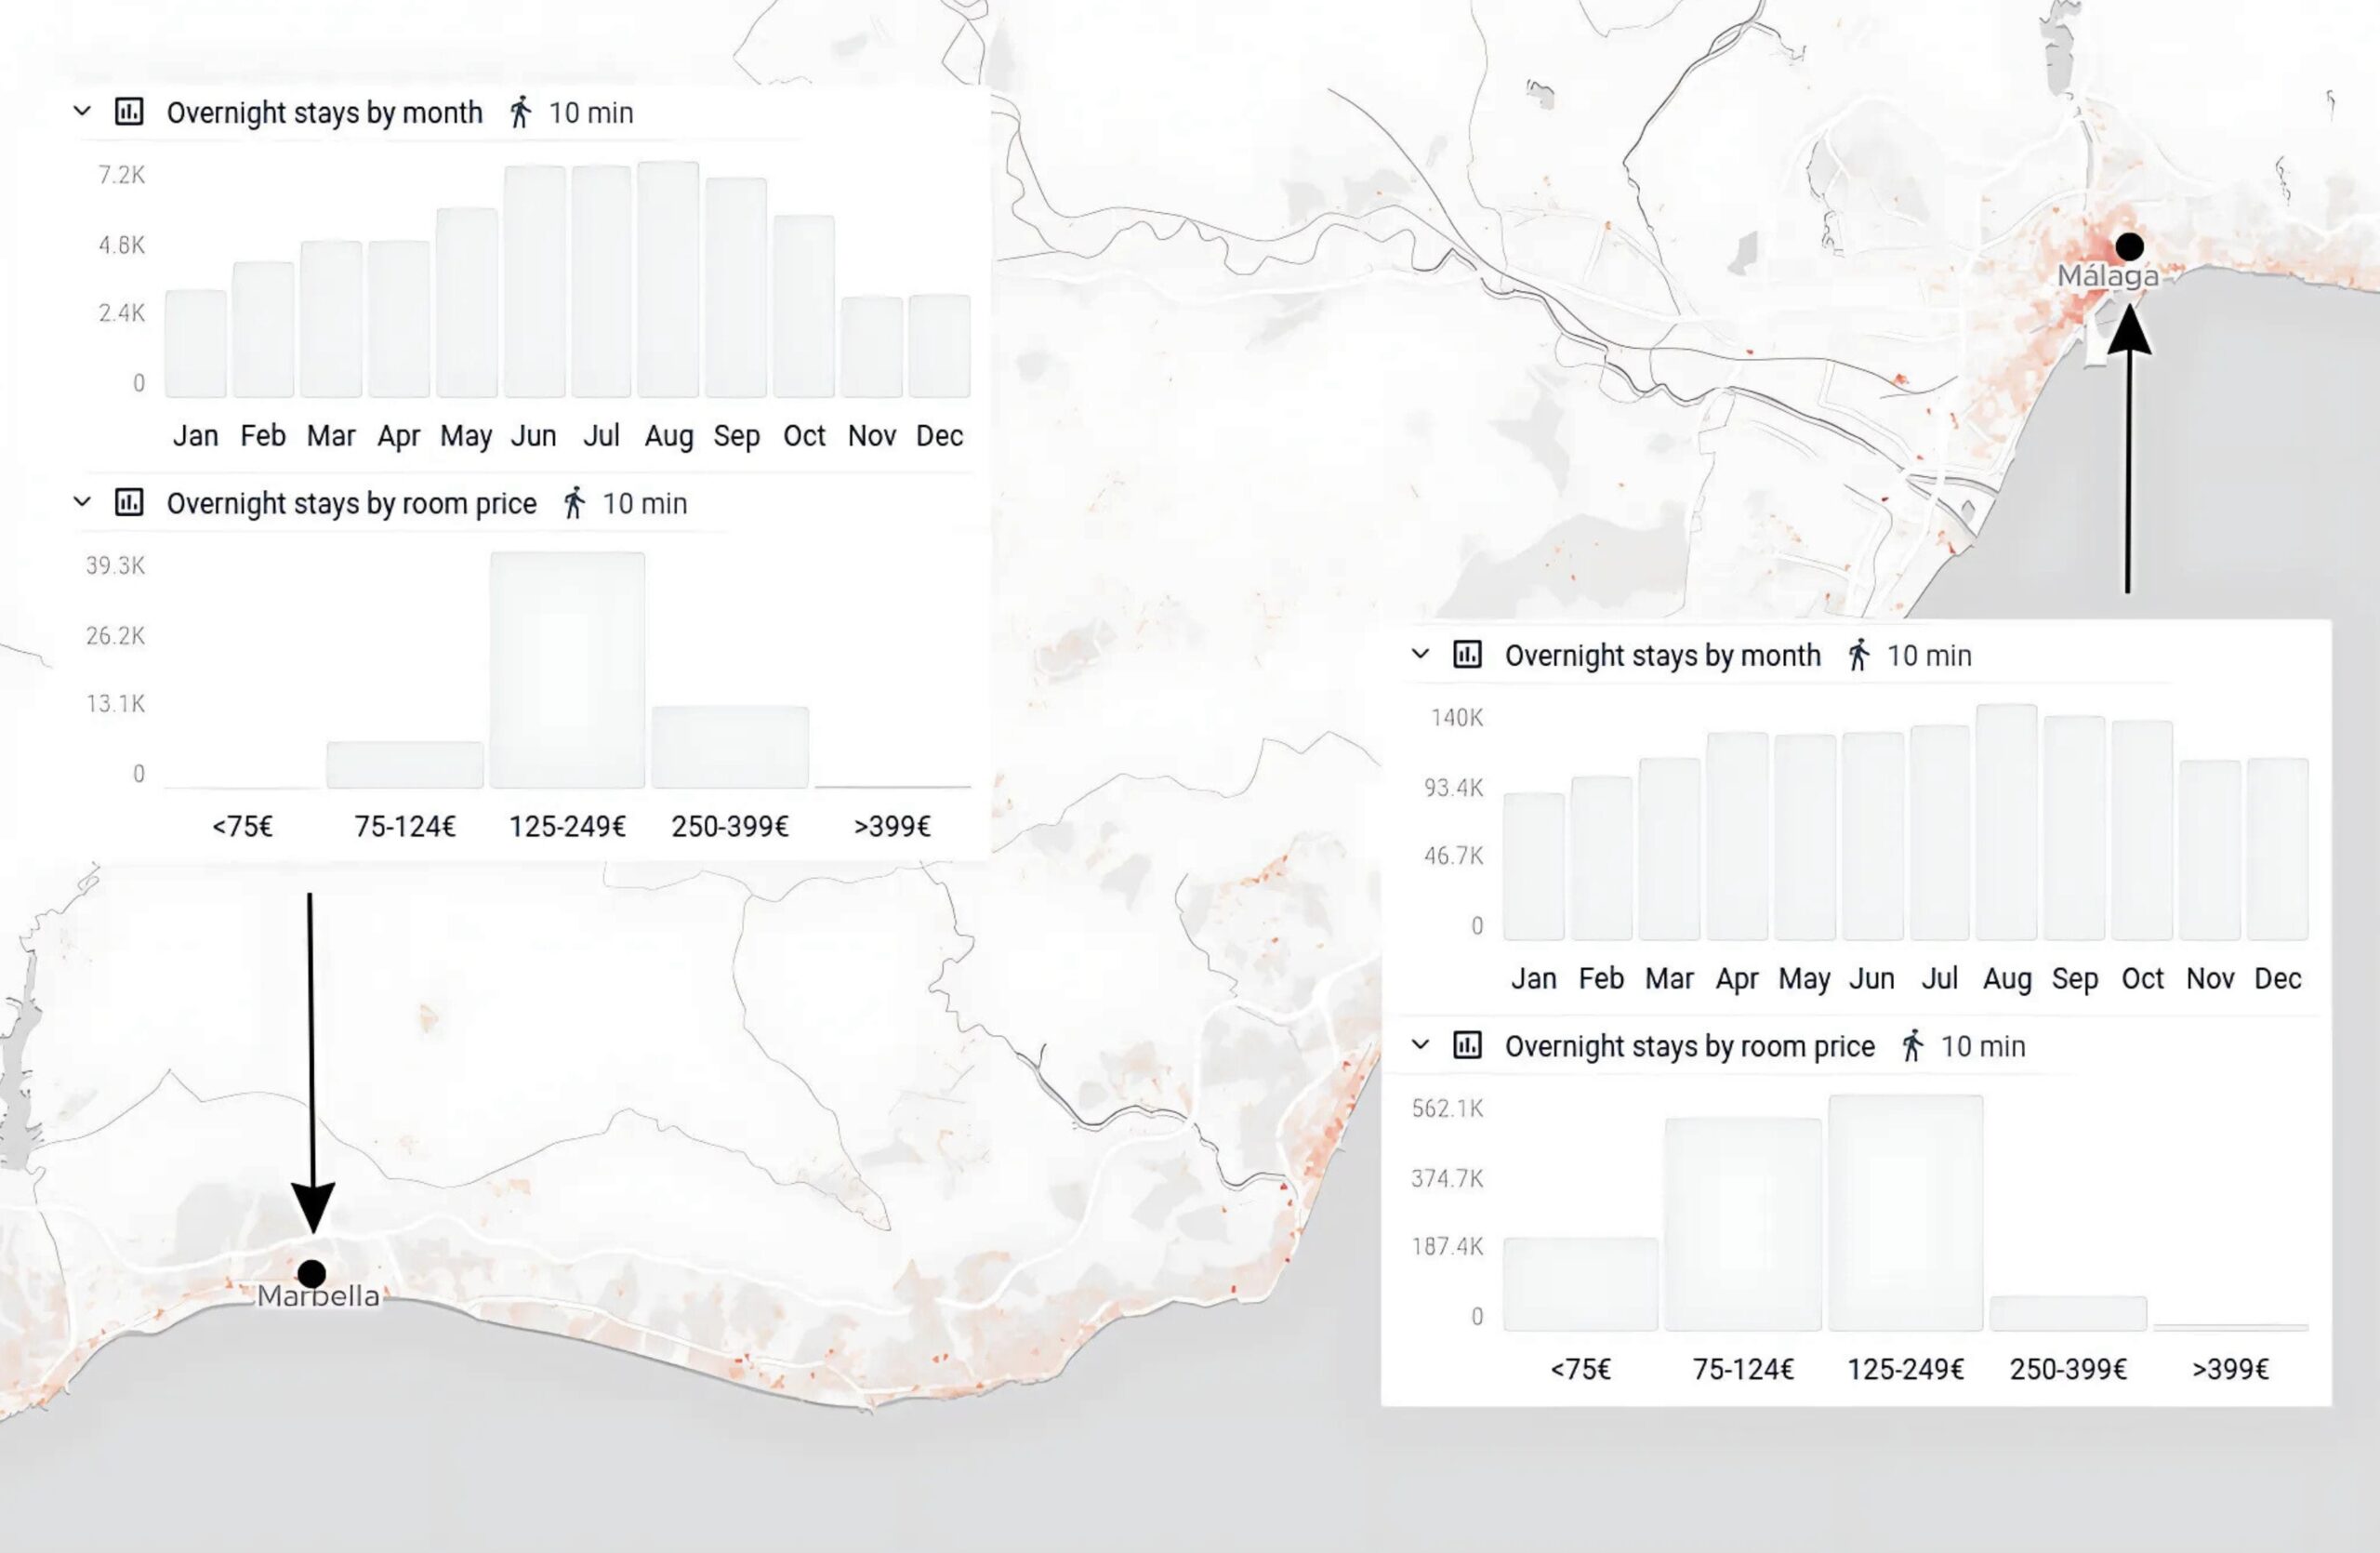
The room-price data reveals clear differences: Malaga attracts more budget-conscious travellers, while Marbella draws a higher share of premium visitors, a strong indicator for luxury accommodation and upscale dining potential. These insights enable decision-makers to time openings, adapt offerings, and plan operations with confidence, turning seasonal volatility into a measurable advantage.
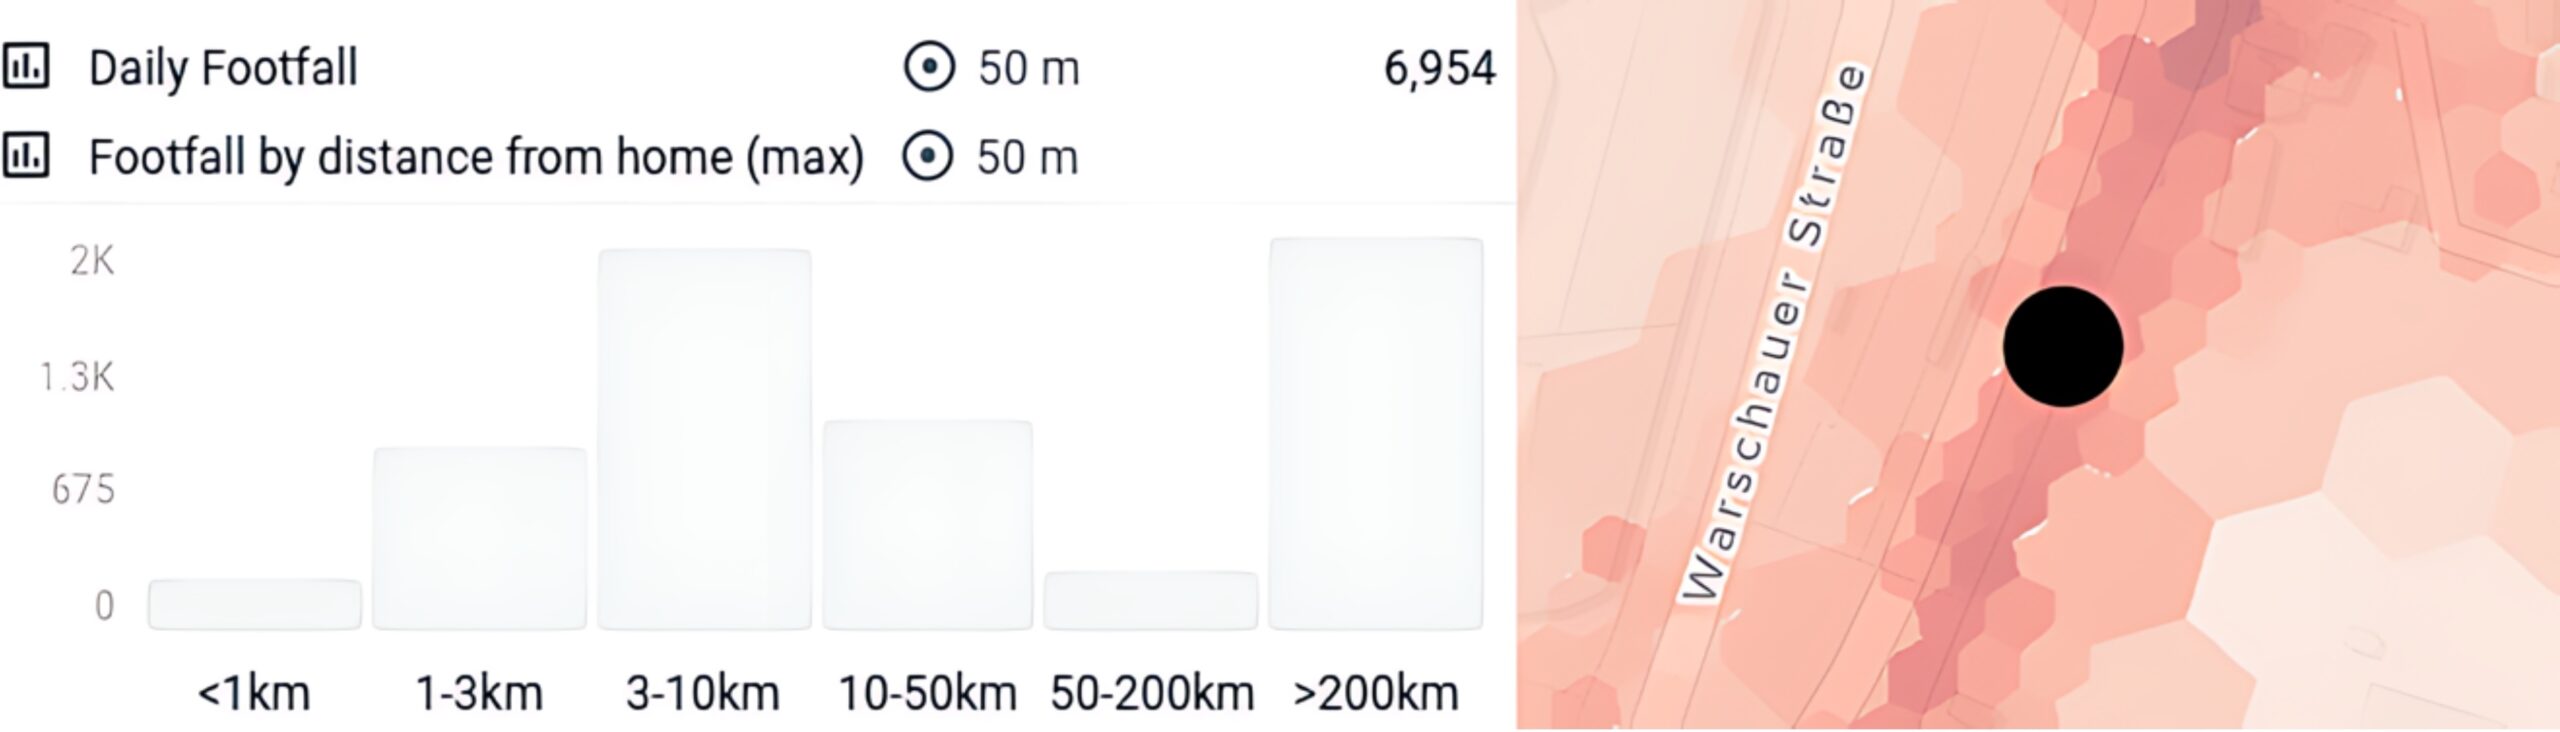
Local vs Tourist Footfall: Targeting the Right Audience
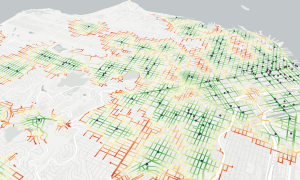
Tourism analytics data also reveals who actually passes a location: tourists, locals, or commuters. In Berlin, the East Side Gallery area shows a strong tourist presence along the river, while nearby streets are dominated by locals.
This clarity lets brands tailor their offerings precisely: souvenir shops and cafés where visitors linger; convenience retail and fitness studios where residents dominate.
Tourists vs Locals near East Side Gallery, a popular tourist spot in Berin, Germany. Move the sliders to discover the difference.
Why Expansion Managers Trust Targomo’s Data
reliability is the biggest challenge with most mobility or tourism datasets. Targomo overcomes this through transparent validation and trusted data partnerships that ensure every dataset reflects real-world trends.
- We use official tourism statistics and booking-platform data to validate accommodation locations and guest counts.
- Tourism footfall is validated separately: it is benchmarked against laser pedestrian counters and cross-checked with manual street counts, following the same methodology as our Footfall Data validation.
This gives expansion teams confidence to plan using data that truly represents how people move, stay, and spend.
How Experts Use Tourism Analytics Insights
Targomo’s validated tourism data supports expansion decisions across various industries:
- Retail chains benchmark potential locations against top-performing stores, identifying gaps and high-opportunity zones.
- Restaurants assess whether an area’s tourist-to-local ratio and spending profile match their concept and evaluate nearby competition before expansion.
- Hotels and serviced apartments analyse neighbourhood attractiveness, traveller mix, and accommodation saturation to prioritise the most promising expansion areas.
Smarter Expansion with Tourism Analytics Data
Tourism analytics turns uncertainty into strategy. With Targomo’s Tourism Analytics Data, expansion teams gain visibility into how tourists move, where they stay, and what their spending power is.
By combining tourist footfall and accommodation insights, Targomo gives decision-makers a foundation for evidence-based growth, whether planning a new retail site, a hotel opening, or a restaurant network expansion.
You May Also Be Interested in