


When starting or expanding a business, location selection is a matter of fundamental importance for both established and young companies. In practical terms, identifying a location that performs well for a new branch (e.g. many visitors and high turnover) is a very complex problem. Various interdependent variables, such as socio-demographics, competition, and distance from other points of interest, contribute to the attractiveness of a specific location for a particular business model.
Fortunately, state-of-the-art technologies and market models can provide unbiased and analytical solutions to location selection in a matter of seconds. At the core of Targomo’s location intelligence lies the gravity approach described in this article. It is applicable to any site around the world and is based on the combination of automatic travel time computation, census and proprietary data for precise KPI predictions.
How to Choose the Best Retail Branch Location with Data-Driven Analysis
Opening a new retail branch is a complex and yet fundamental business problem. Investing in a new location can be a risky process, and a precise preliminary assessment is key to avoiding a negative long-term impact on the business. Such assessments need to account for diverse factors like suitability of the area, amenities and competitor activity in order to predict how successful a given location will be and to create the most value.
Companies willing to expand their retail site network are faced with the following questions:
- How to define a successful location for my retail branch network from an objective point of view?
- How to predict retail location performance, like sales revenue and number of visitors?
- How to correctly account for competition and cannibalisation?
When tackling these questions, companies are presented with a multitude of different strategies, and it is not easy to choose the most suitable methods. Extensive field studies and surveys are among the most common strategies adopted by retail businesses today. Companies lacking in-house expertise on location intelligence must rely on external knowledge. High costs and time expenditure aside, in both cases, the conclusions of the analysis are prone to biases and errors due to poor data quality or human-driven data interpretation, and are often applicable only to a specific case study.
A more cost-effective, reliable and generalizable approach for choosing the best retail branch location is the usage of data-driven analytical frameworks leveraging theoretical economic models. The approach we present here combines precise travel time estimations, big data (e.g. census or proprietary data), theoretical market models (such as gravity models) and artificial intelligence (AI) to produce reliable and fast predictions of branch Key Performance Indicators (KPIs)—e.g. number of visitors or sales. We believe that such location assessment tools can provide insightful answers to all the former questions based on informed assumptions.
What Are Gravity Models in Retail Location Analysis?
The idea of the “gravity market model” stems from the concept of Newton’s law of gravitation. This law describes the attraction between celestial bodies, stating that the strength of this gravitational force is proportional to (the product of) their masses while it is inversely proportional to the (squared) distance between the two bodies. In short: High masses and low distances lead to strong attraction. By treating retail locations as celestial bodies, these basic principles can be effectively applied to the realm of retail branch network planning. Using this analogy, an equation equivalent to the gravitational field can be formulated, representing instead the attractiveness of a shop to customers.
Gravity market models offer a mathematical way to predict the likelihood that a consumer in a given area will become a regular customer of a store, taking into account both the retailer’s own branches and competing locations. This probability depends strongly on two factors:
- The travel time needed for the consumer to reach the location
- The “attractiveness” of a store, which takes into account that customers are sometimes willing to accept a longer travel time to reach a larger or more stocked store
Despite the many extensions, adaptations, and flavours of the gravity model that have been developed, they are all derived from Huff‘s original formula:
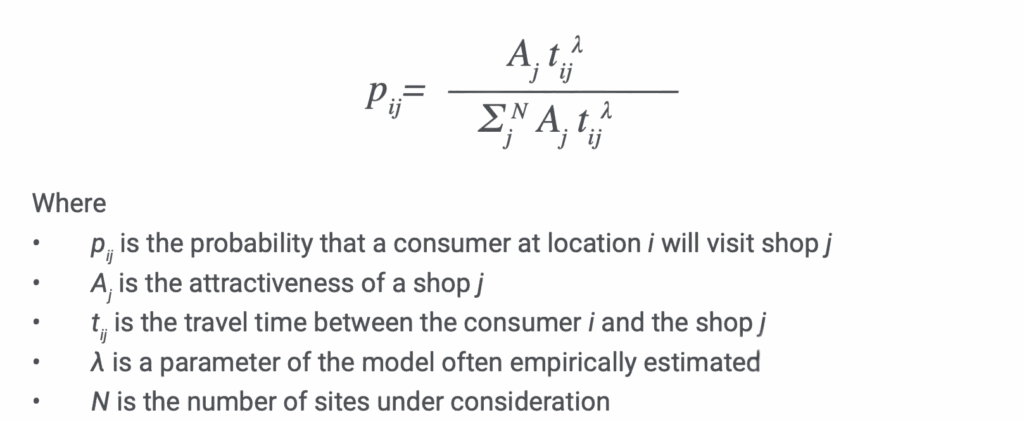
The denominator serves as a normalisation constant, making the output of the model a probability: it is indeed the sum of the terms in the numerator over all shops under consideration.
Why Travel Time Analysis Matters for Retail Site Selection
By calculating the visiting probability for a specific retail branch network and its competitors, it is possible to predict the location performance of any potential site for expansion. Because this likelihood strongly depends on travel time between the consumer and the store, accurate predictions require a precise and efficient routing tool that can quickly calculate travel times across a large number of addresses.
When the gravity analysis based on travel time is applied to both the existing retail branch network and the competing network, the results display an objective representation of catchment areas with different visiting probabilities for both entities. They are accounting for competition as well as for cannibalisation effects. Once this is done, multiple theoretical new locations can be added to the branch network. The model will immediately calculate the ramifications of the new network layout, enabling the user to dynamically and intuitively test different strategies.
How Store Attractiveness Shapes Retail Location Performance
Nevertheless, travel time is not the only factor determining the choice of customers. People might be willing to travel further to reach their favourite shop, a certain product, or a larger shopping area. Combining distance with the attractiveness of a site is key to the gravity formulation of retail performance prediction.
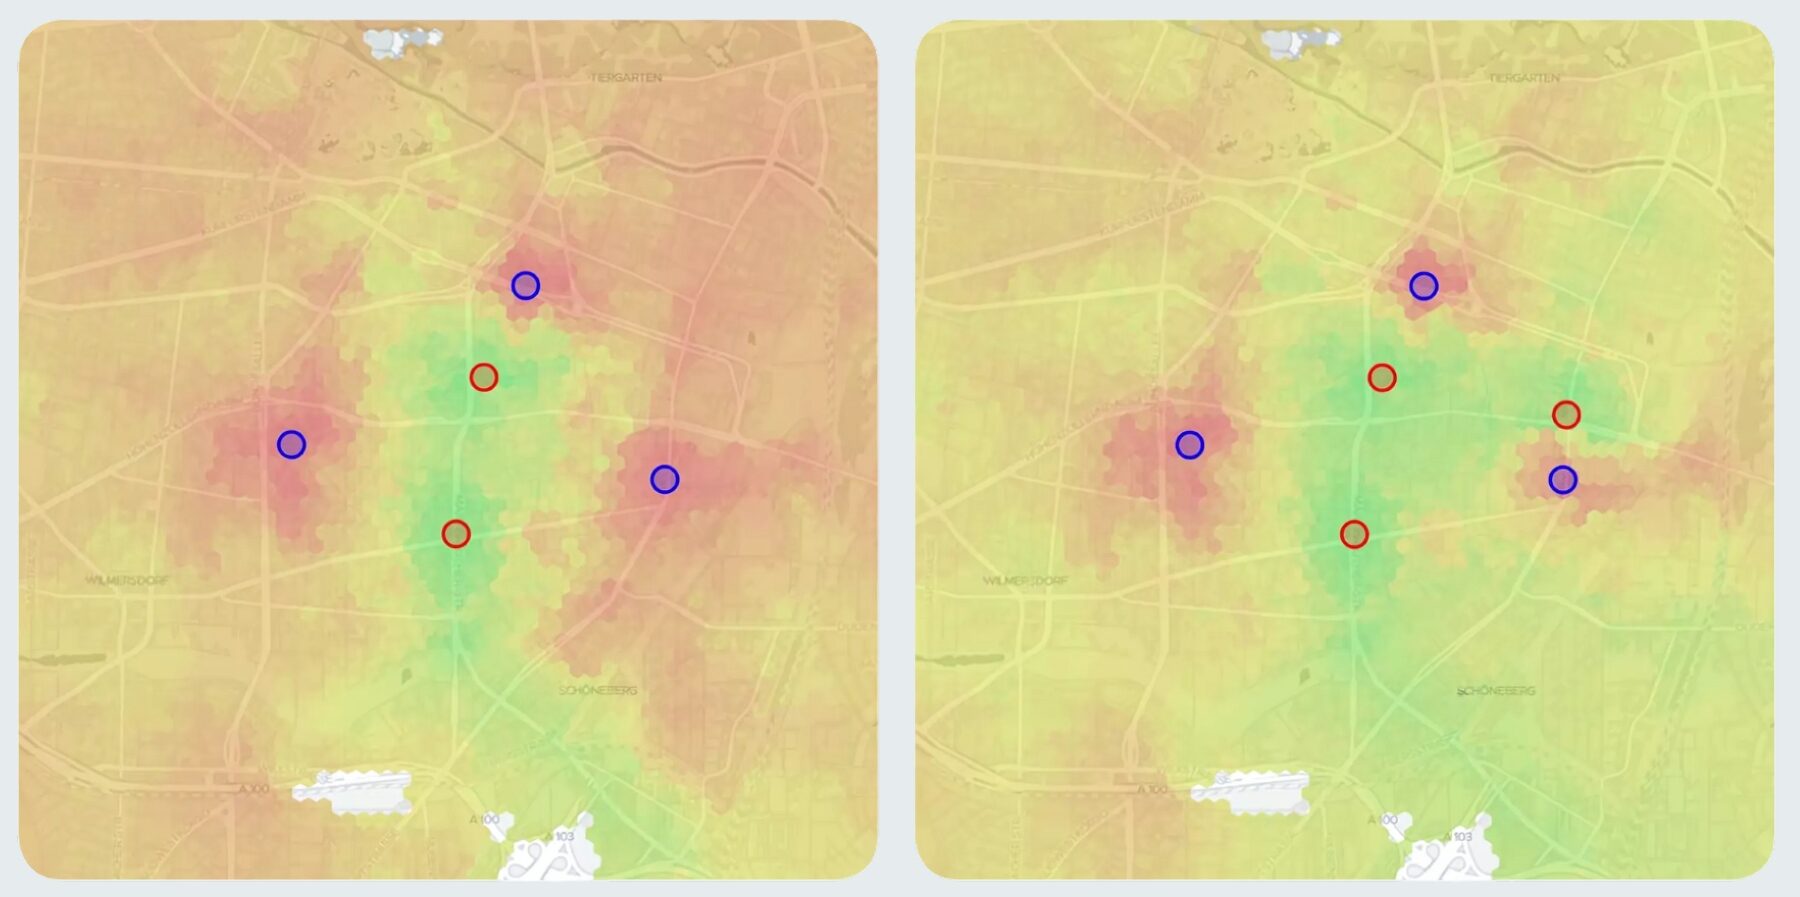
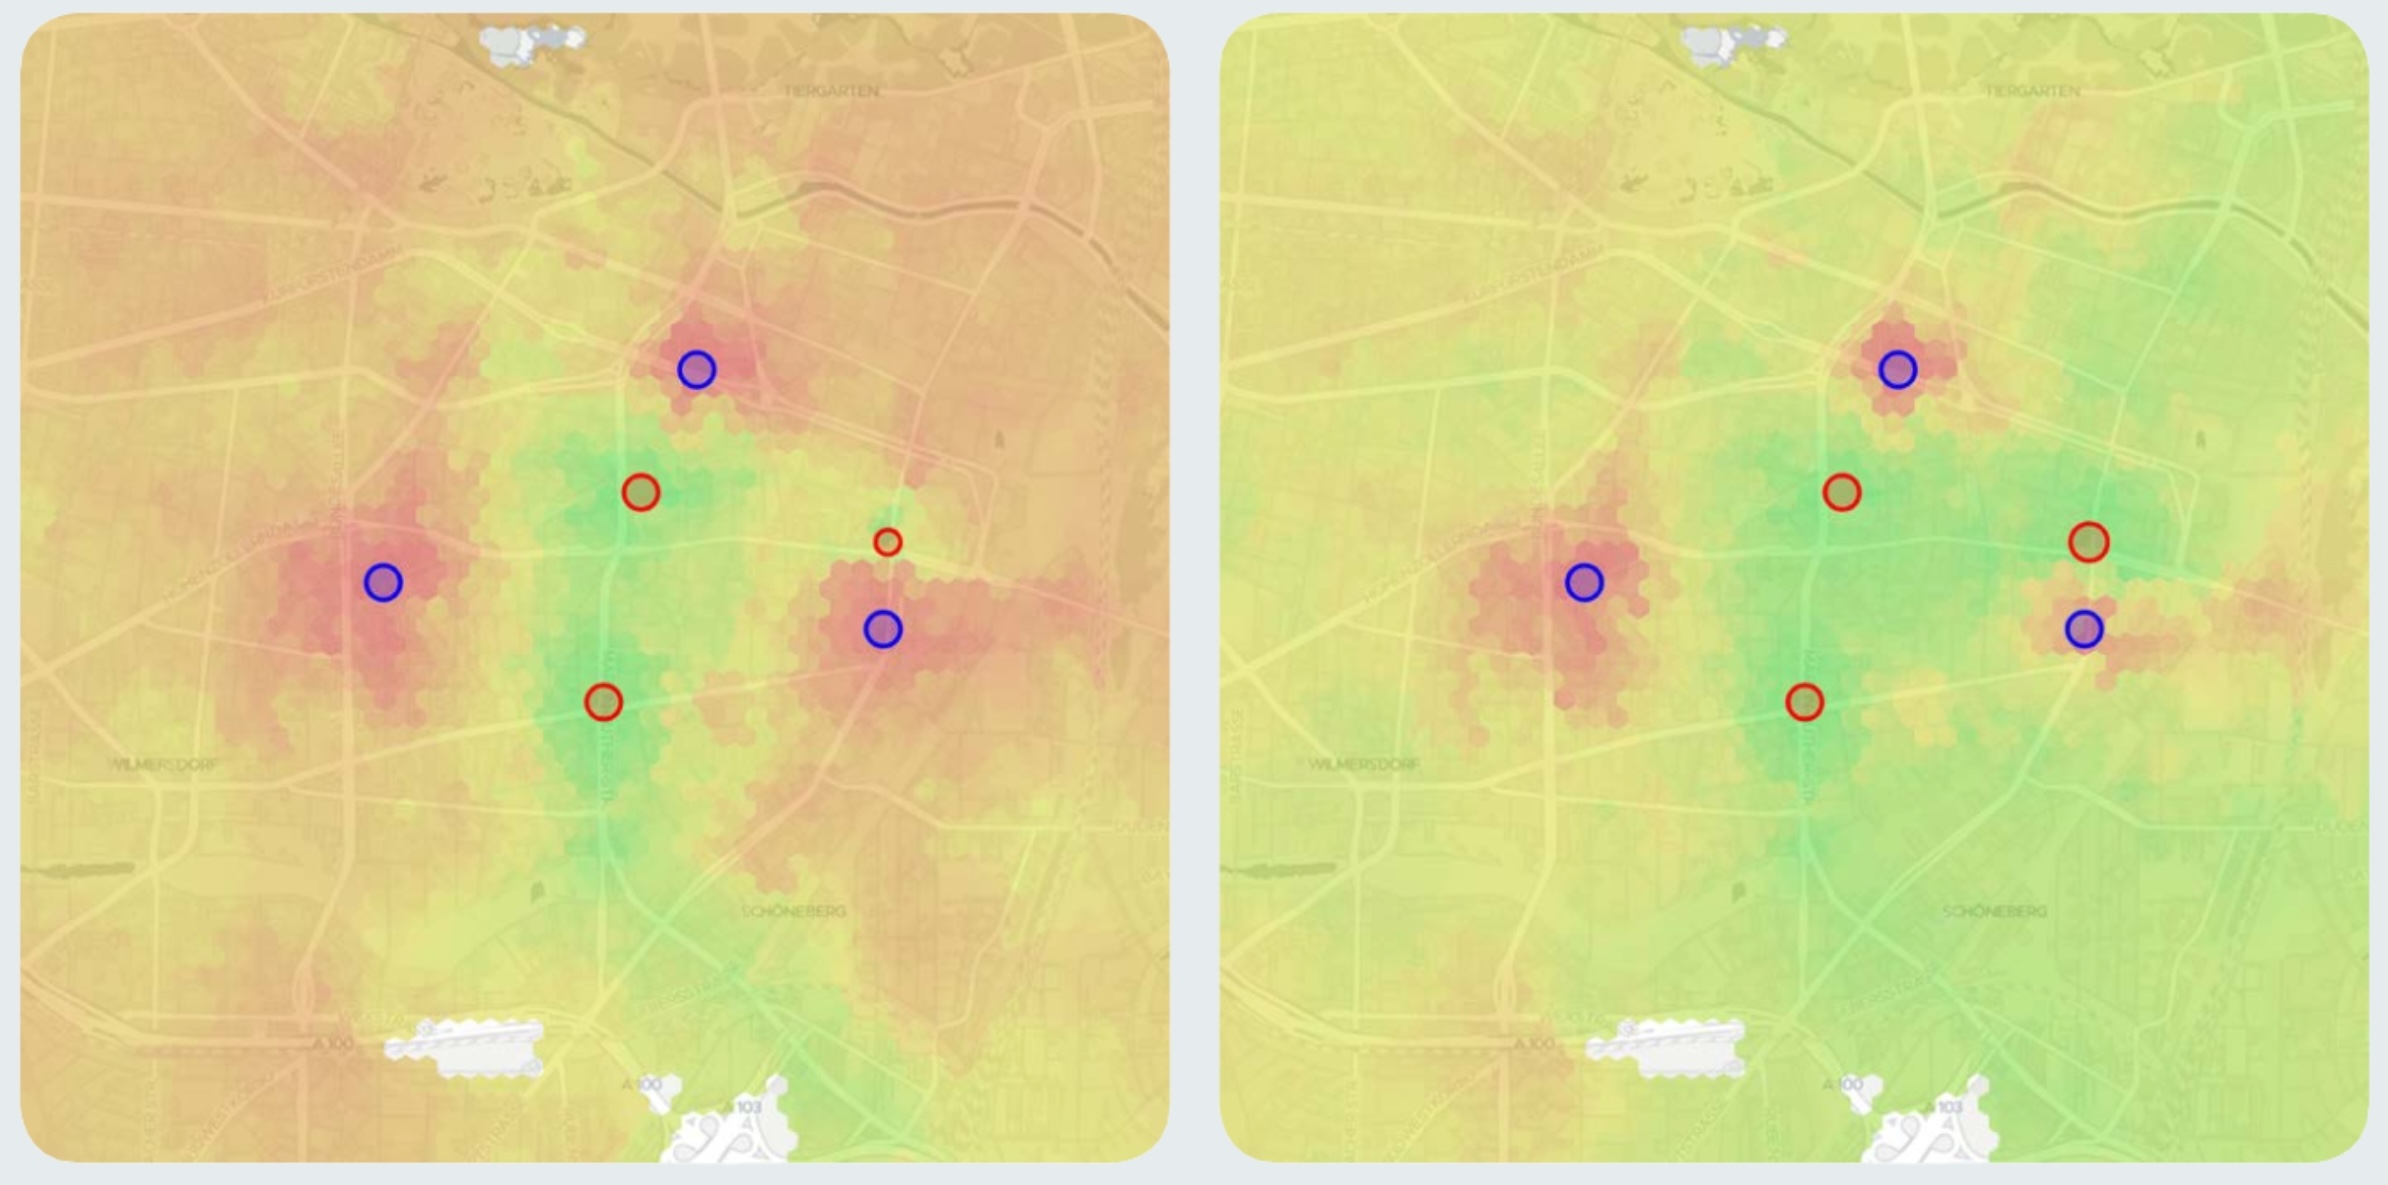
Attractiveness summarises all store factors that appeal to customers, such as available parking, product range, or prices. Importantly, this number can be defined in different ways according to different business cases, as the relevant features of a store might change drastically depending on the retail strategy. The images below showcase how the gravity model output changes once the attractiveness of a store is changed.
Using Demographic and Census Data to Predict Store Visitors
Measuring and characterising areas with a high visiting probability alone is not sufficient to exhaustively predict the performance of a location—this is hardly more obvious than when imagining a store in an area with a very low population density. Although the potential catchment area is large, the total number of customers the store attracts is still small. Thus, the gravity model analysis needs to be enriched with social and economic demographic data that characterise a location. Census data provides an obvious example of how to combine statistics with the output of the model (the visiting probability) in a meaningful way to predict key performance indicators like the number of visitors.
Here, it is important to understand that the gravity model is applied on a point-to-point basis. One analysis is composed of thousands of individual calculations, all of which are carried out from two coordinates—the coordinates of a store and the coordinates of a consumer. Assuming that the visiting probability of a specific store location has already been identified for all potential customer locations within the catchment area, a simple multiplication of these probabilities with the number of people living in the respective locations (according to the census) allows for a prediction of the total customer numbers that the store will draw.
Advanced Strategies to Improve Gravity Models for Retail Planning
As no two companies are the same, the gravity analysis should ideally be tailored to the specific business strategy. There are multiple ways to increase the predictive accuracy of the individual model.
Leverage the Existing Data of the Retail Network
An already established store network holds valuable data on sales, transactions, and customer numbers. These existing branches should be used to tune the gravity model, so predictions can be tested against real data. This allows for the optimisation of multiplicative coefficients and exponents in its formula via regression analysis, resulting in the most realistic outputs.
Incorporate Socio-Economic Data of the Target Group
The sharper the image of the business’s target group, the more precisely statistical data can be leveraged. For example, if products are mainly sold to people above the age of 65 or women between 18 and 29, census data should be filtered by age prior to the analysis.
Adjust Means of Transportation for Potential Clients
As stated above, travel time serves as a starting point of the gravity model analysis, since it defines the distance between the consumer and the product or service. The analysis should be driven by the means of transport normally used by the target group, because the reachability patterns of cars, bikes, or public transport differ significantly.
Integrate Multiple Data Sources into the Prediction Model
If it’s clearly known why and how customers interact with a business, additional data sources can be added to get the most out of gravity model analysis. For retail branch networks heavily relying on footfall, the use of high-quality cellular data might prove useful. If products and services are targeted at vehicle owners, car registration data could be a valuable addition. As too much noise will necessarily distort the end result, a careful selection and balance of data sources is mandatory.
The Math Behind the Gravitational Model
In a more advanced version of the model, agglomeration effects are also taken into account. The term “agglomeration” refers to the influence that other points of interest in the surrounding area, including competitors’ activities, have on the attractiveness of a location. Imagine you open a new shop in the middle of a residential area. No matter how big or well-furnished your shop is, it would most likely attract more customers if it were opened in the largest shopping mall in town. From a mathematical point of view, agglomeration has been implemented in gravitational models by means of an additional multiplicative factor:
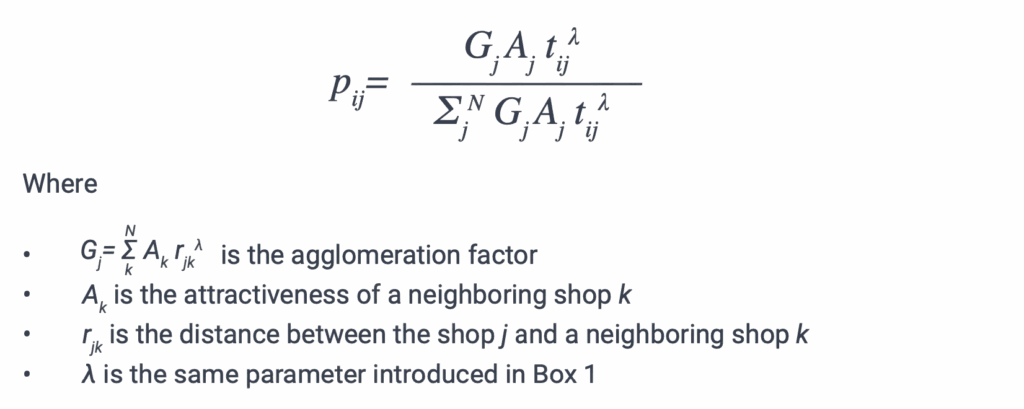
To allow more degrees of freedom in the model, two more parameters can be added in the form of two exponents (α and β) to the power of which A and G are raised. These more elaborate models can, in theory, produce more accurate and case-specific estimations, since parameters can be tailored to custom data, but come at a cost of a more labour-intensive parameter estimation procedure and at the risk of rendering the model too versatile, thus being prone to what in machine learning jargon is referred to as “overfitting”.
Step-by-Step Workflow of Retail Gravity Model Analysis
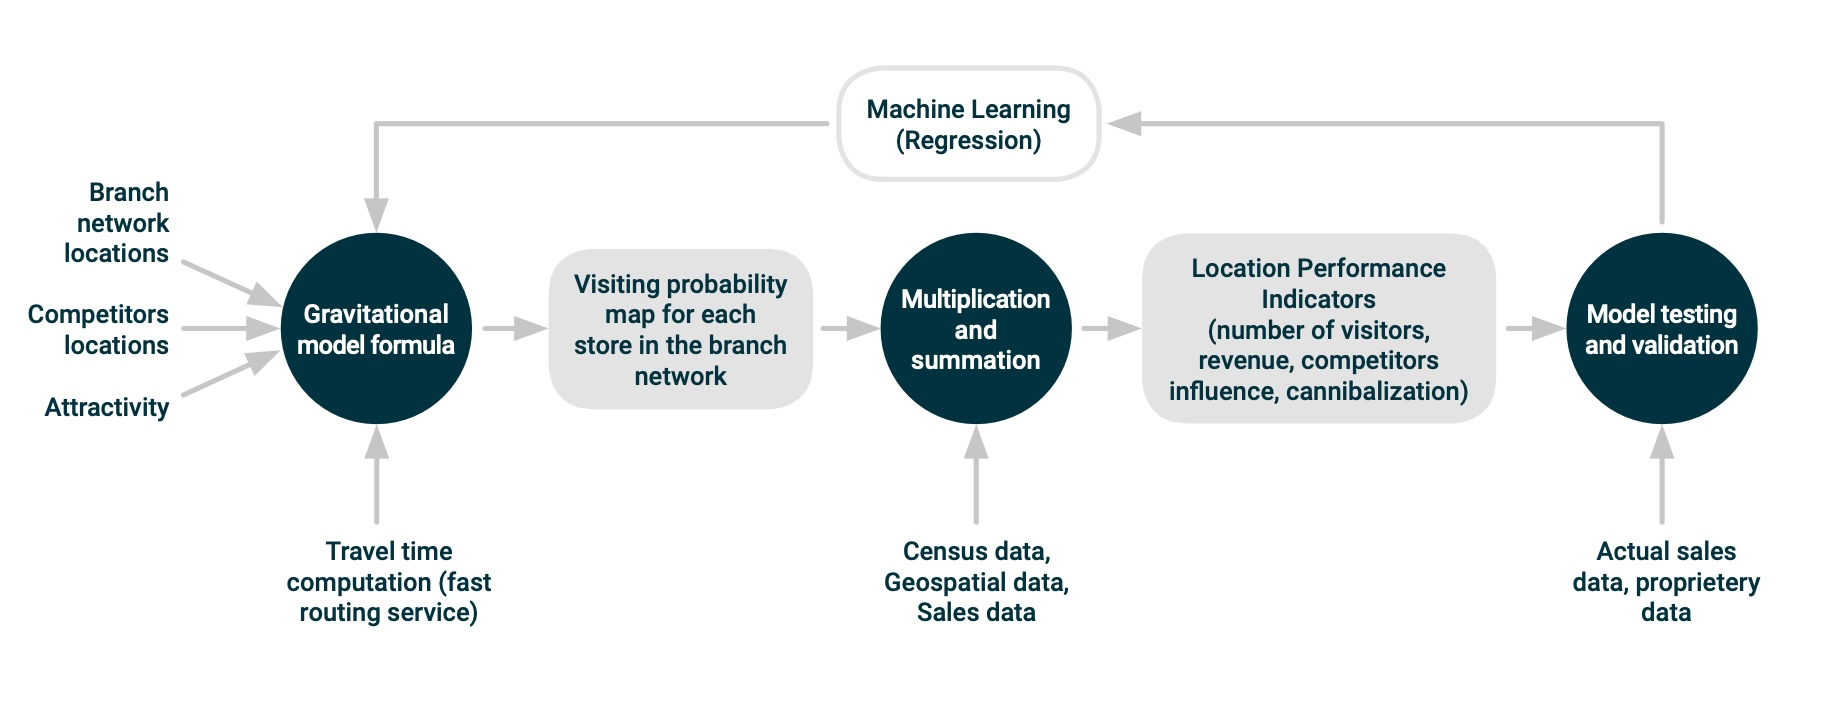
In the chart below, we visualise the process and the requirements to set up a gravity-based analysis pipeline. The basis for all calculations is the coordinates of one’s own branches (planned or existing) as well as those of the competition. The attractiveness multiplier will later determine the “gravitational strength” of these locations. Gravity models for retail planning rely on one essential input: the ability to calculate travel times quickly and accurately. As pointed out earlier, the probability that a customer visits a specific store depends strongly on the travel time between the customer and the store. Thus, to obtain a precise estimation of key performance indicators via gravity analysis, we need to be able to precisely compute travel times between a large number of points (covering a whole neighbourhood or even an entire city) in a short amount of time. Once this has been done, the gravity model produces a map of the visiting probability for each previously defined branch in the network. This is followed by the processing of large data sets such as census data, resulting in a prediction of KPIs such as customer numbers, revenue, and cannibalisation effects. If the process was based on an already existing retail branch network, these predictions can now be tested against the actual sales data. The results can be used to further sharpen the gravity model, so it represents reality as accurately as possible. Ideally, this iterative process is being facilitated by machine learning techniques, which allow for the efficient identification of overarching patterns.
Case Study: Retail Branch Location Assessment with Gravity Models
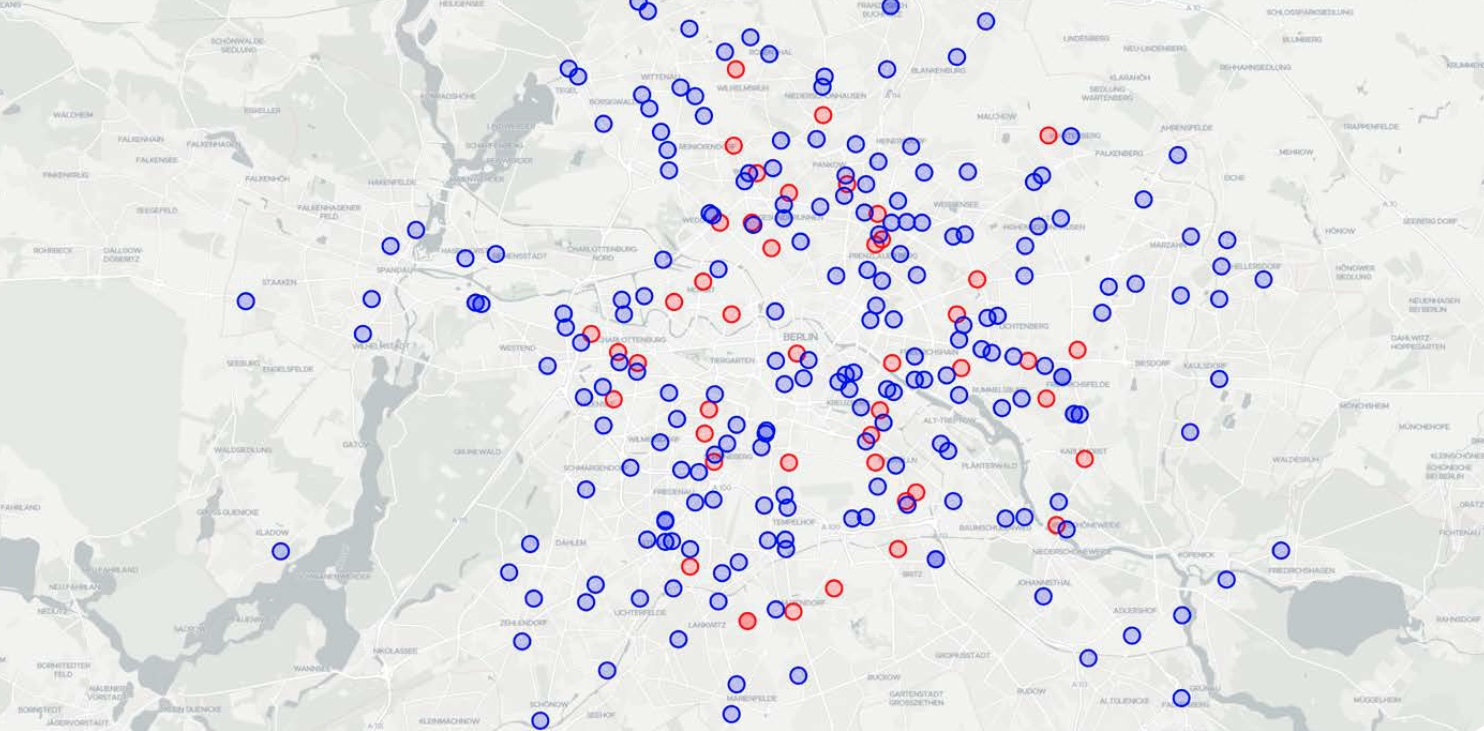
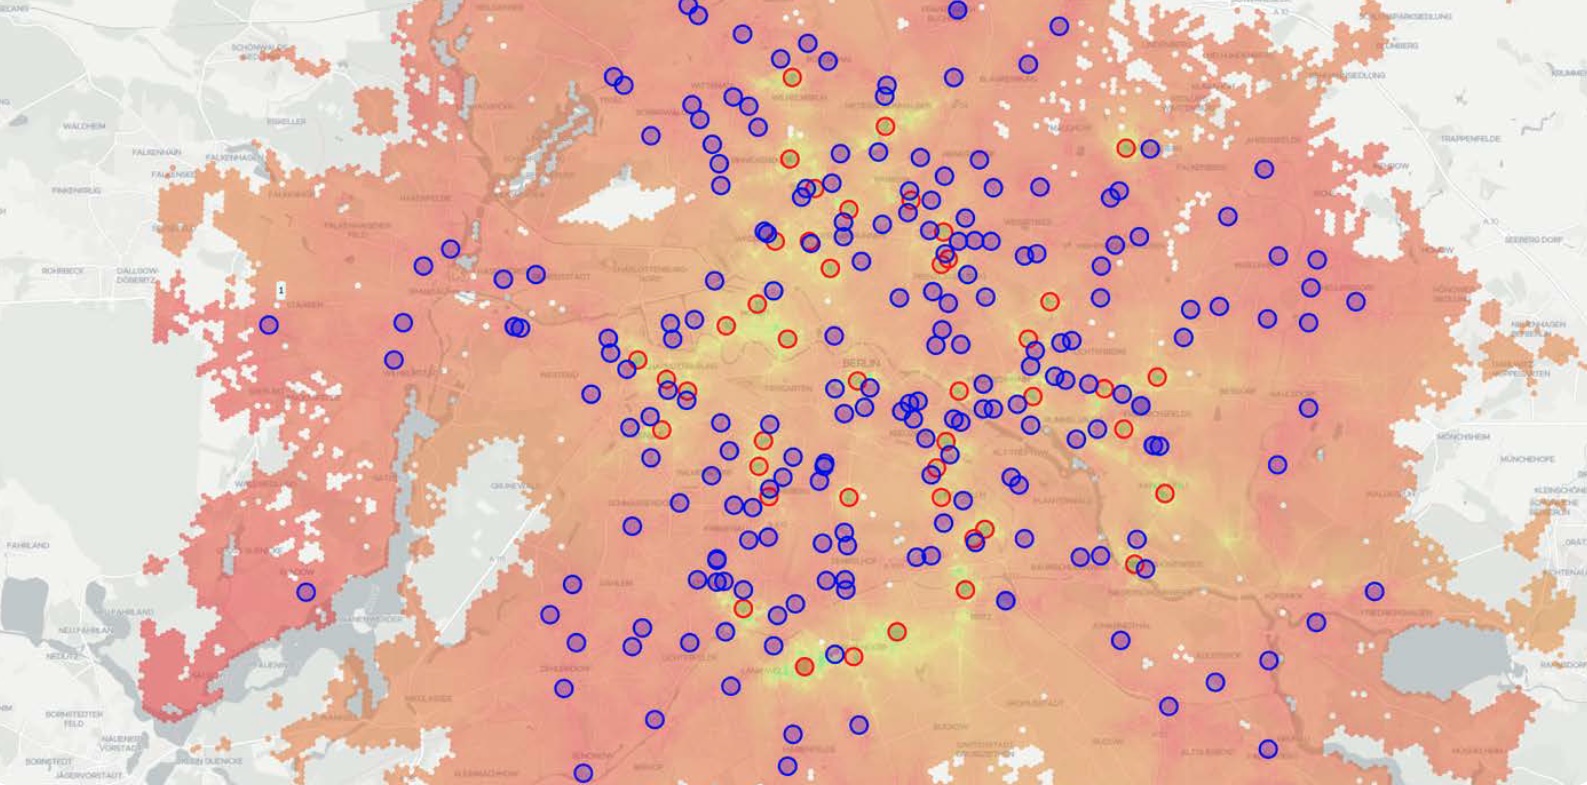
This chapter’s case study serves as an example of a possible real-world gravity model analysis for multi-site location assessment. For the sake of clarity, the process and the variables applied here are greatly simplified. We are taking the perspective of the discount supermarket Penny: In the city of Berlin, it is strongly competing with the discount supermarkets Lidl and Aldi. In our case, Penny wants to evaluate locations that are best suited for a new branch within the city, maximising the number of visitors and the revenue. The following map displays all the locations of the three competing businesses: Lidl and Aldi are both represented in blue, while Penny’s locations are red. The coordinates have been sourced from openly available online directories.
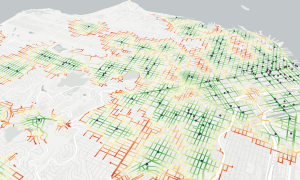
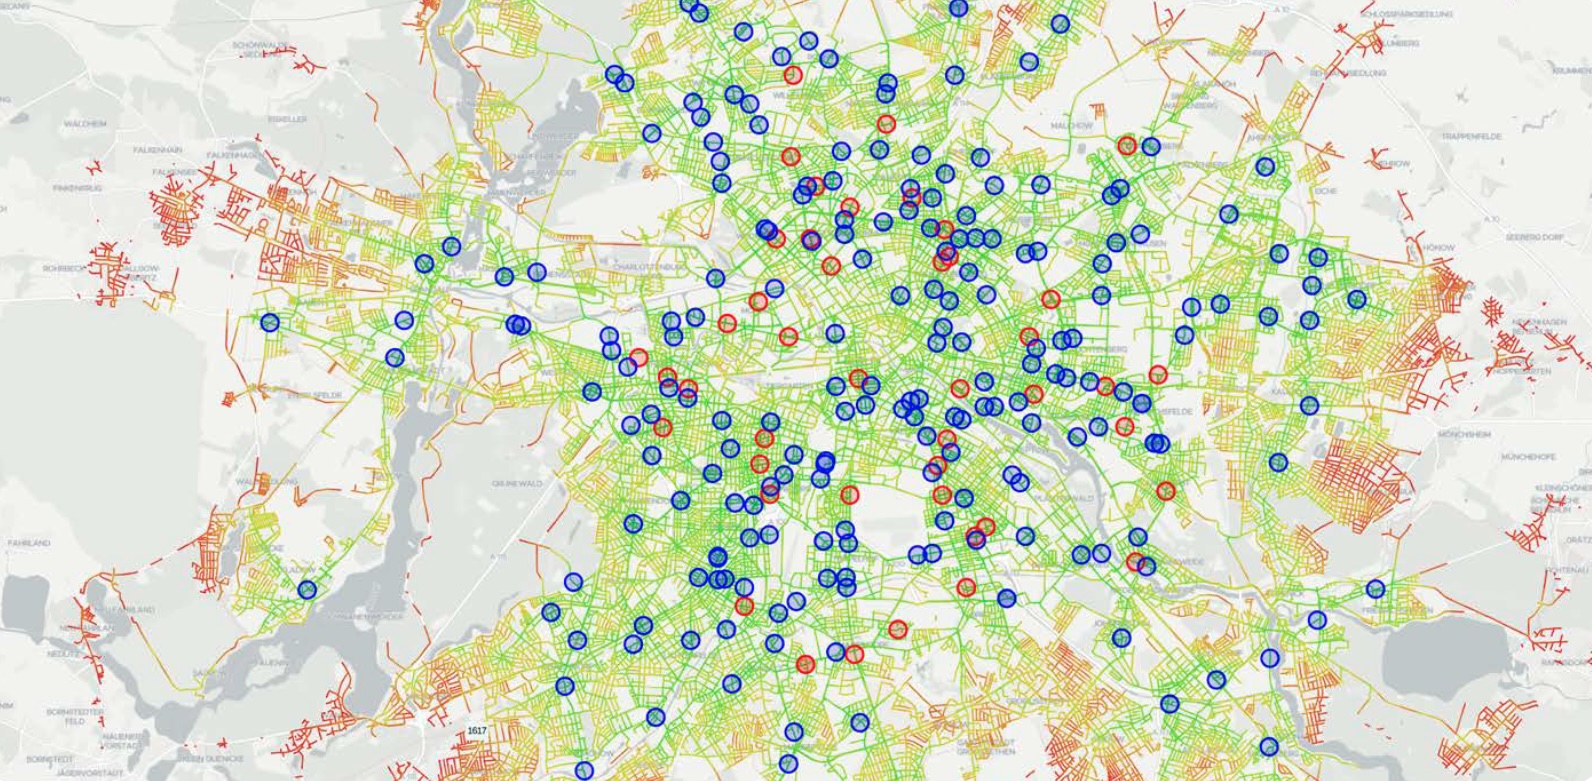
Following the pipeline of our gravity analysis mentioned above, we first need to compute travel times between each coordinate in the city and each retail shop under consideration (Lidl, Aldi, and Penny). The following figure shows the shortest travel time between each point in Berlin and the closest retail shop, obtained via Targomo’s routing API. Roads marked in red correspond to long travel times, while green roads correspond to short ones. The maximum travel time is set to 10 minutes by car.
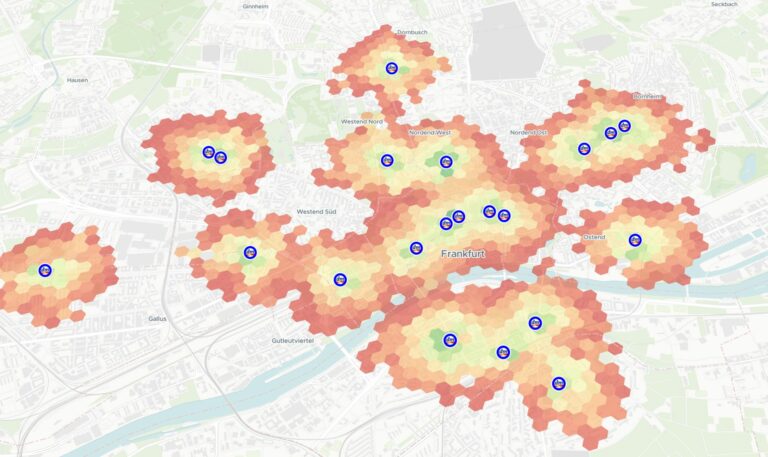
Once we have all the travel times and stores’ locations at hand, we are now ready to perform a gravity analysis in combination with German census data and display the results on an interactive map. The combination of automatic travel time computation, census data, and user-friendly map visualisation already provides an immediate and easy-to-use visual tool to assess which locations could be suitable for branch expansion. For the sake of simplicity, we did not take into account information on single shops—e.g. size in square meters, parking availability and product range—so we are determining that each shop has the same attractiveness value. The following map displays the actual competitive situation between Penny and both Lidl and Aldi. In simple terms, where the map shows a green colour, it means Penny is doing well and drawing customers from those areas. Where the map is red, customers in that area will most likely choose a competitor. Yellow means that there is an approximately equal probability that a customer will choose Penny or one of its competitors.
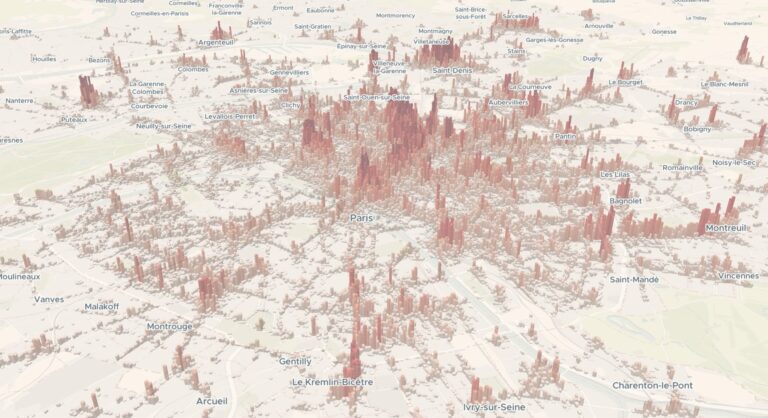
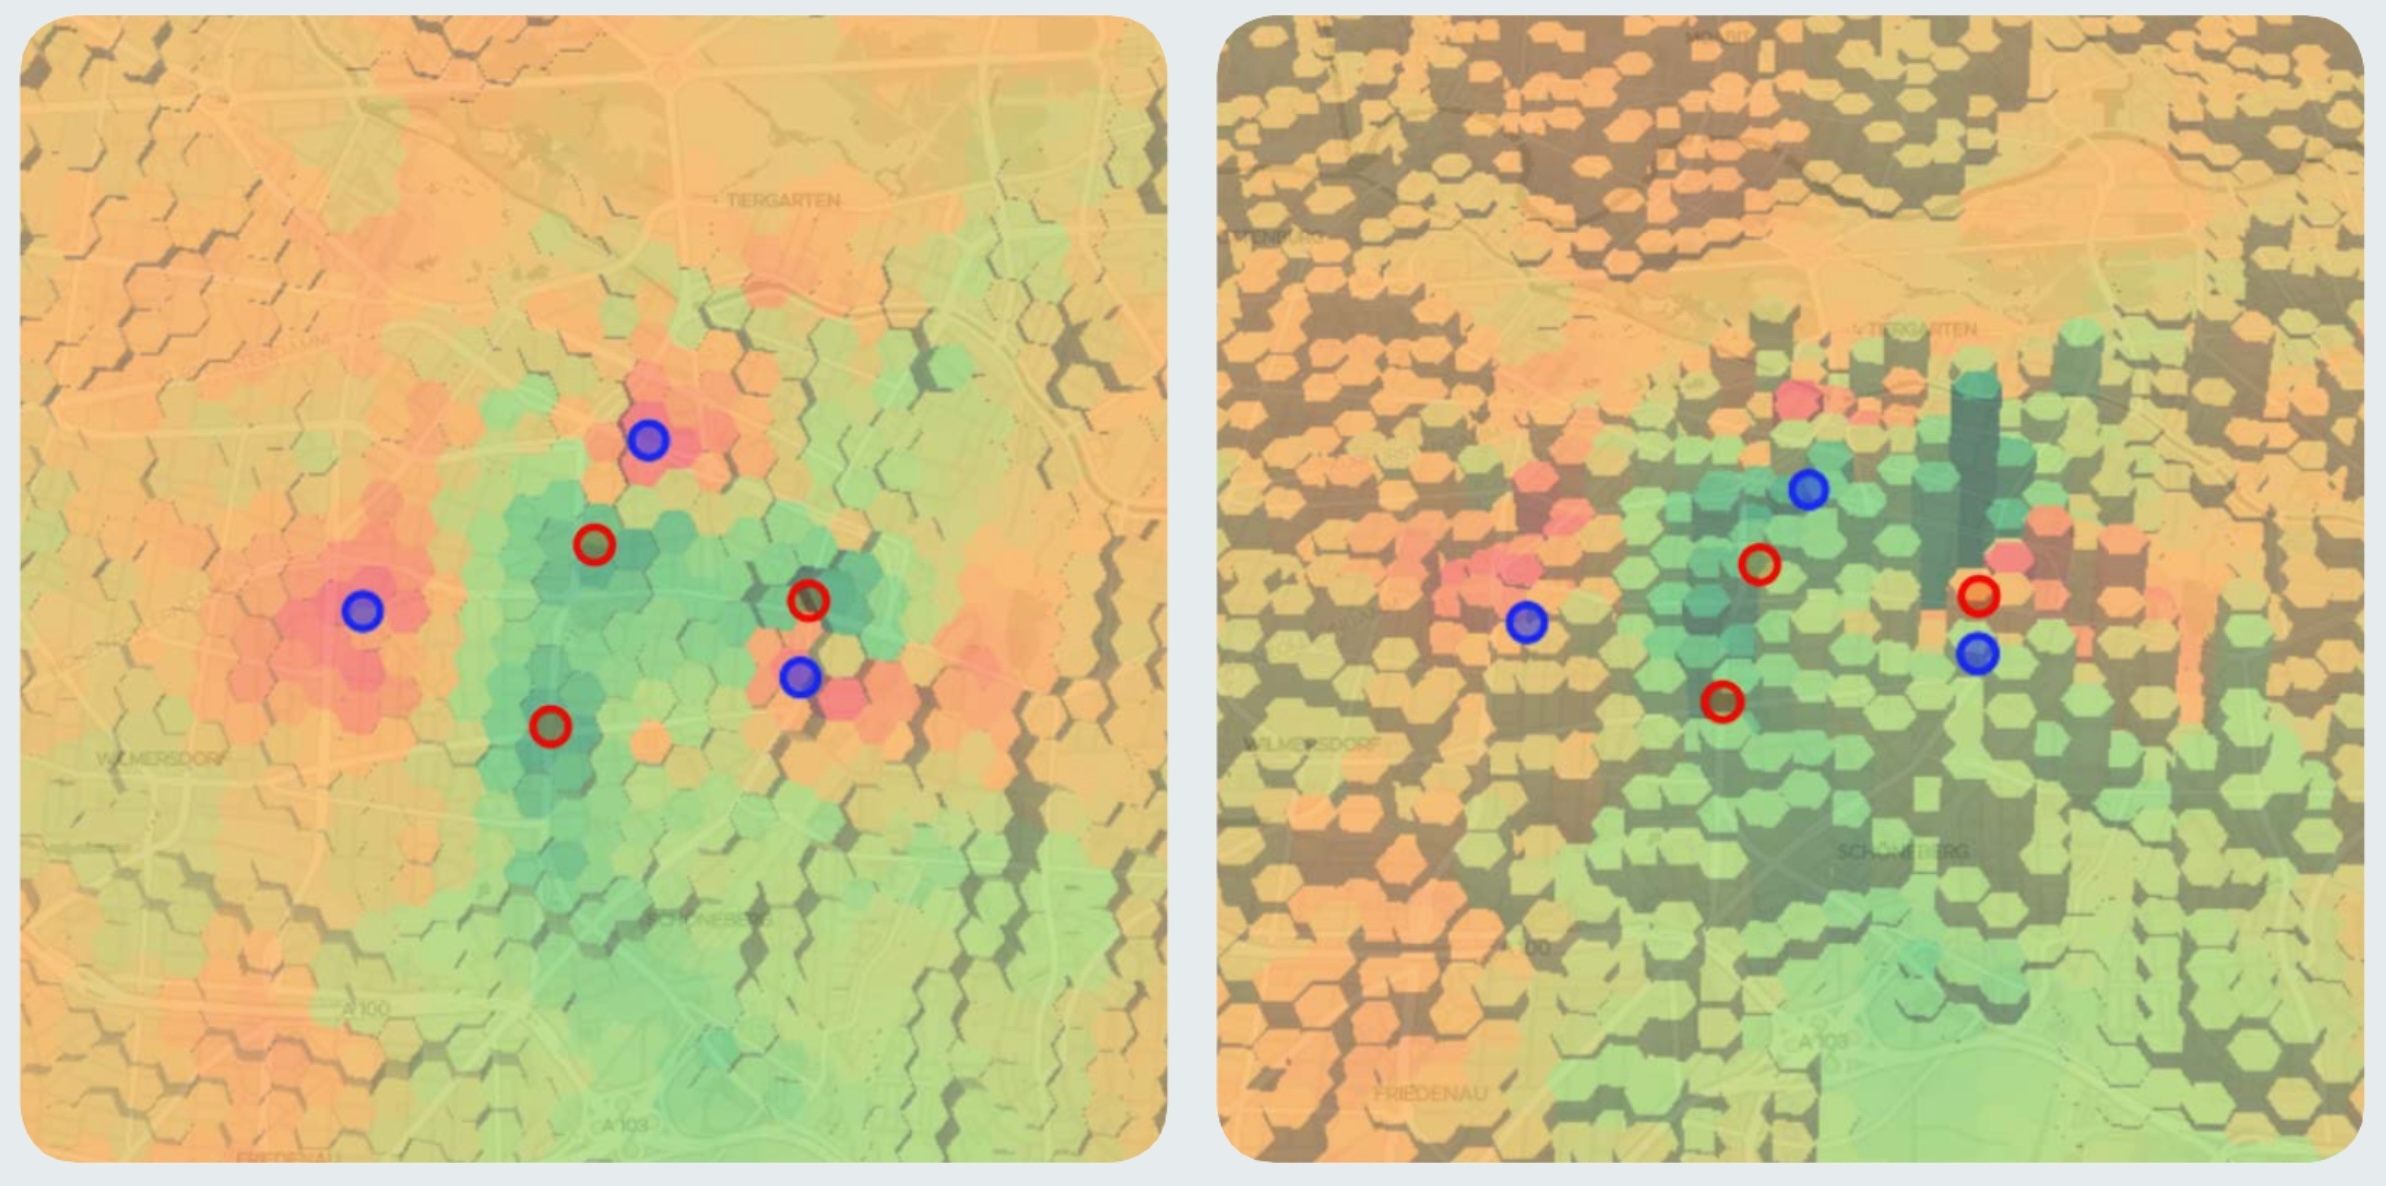
Potentially profitable locations for Penny are, in theory, both red areas, where it could attract customers from its competitors, and yellow areas, which basically correspond to underserved neighbourhoods. However, if those areas are not very populated or are inhabited by the wrong target group, it would not make much sense to open a branch there. We can now enrich our gravity analysis by integrating demographic data. The image below provides an intuitive representation of the information delivered by census data (age 18 to 65): the bars’ height represents the number of people living in that tile, while the colour scheme is the same as above and reflects the gravity strength of each location.
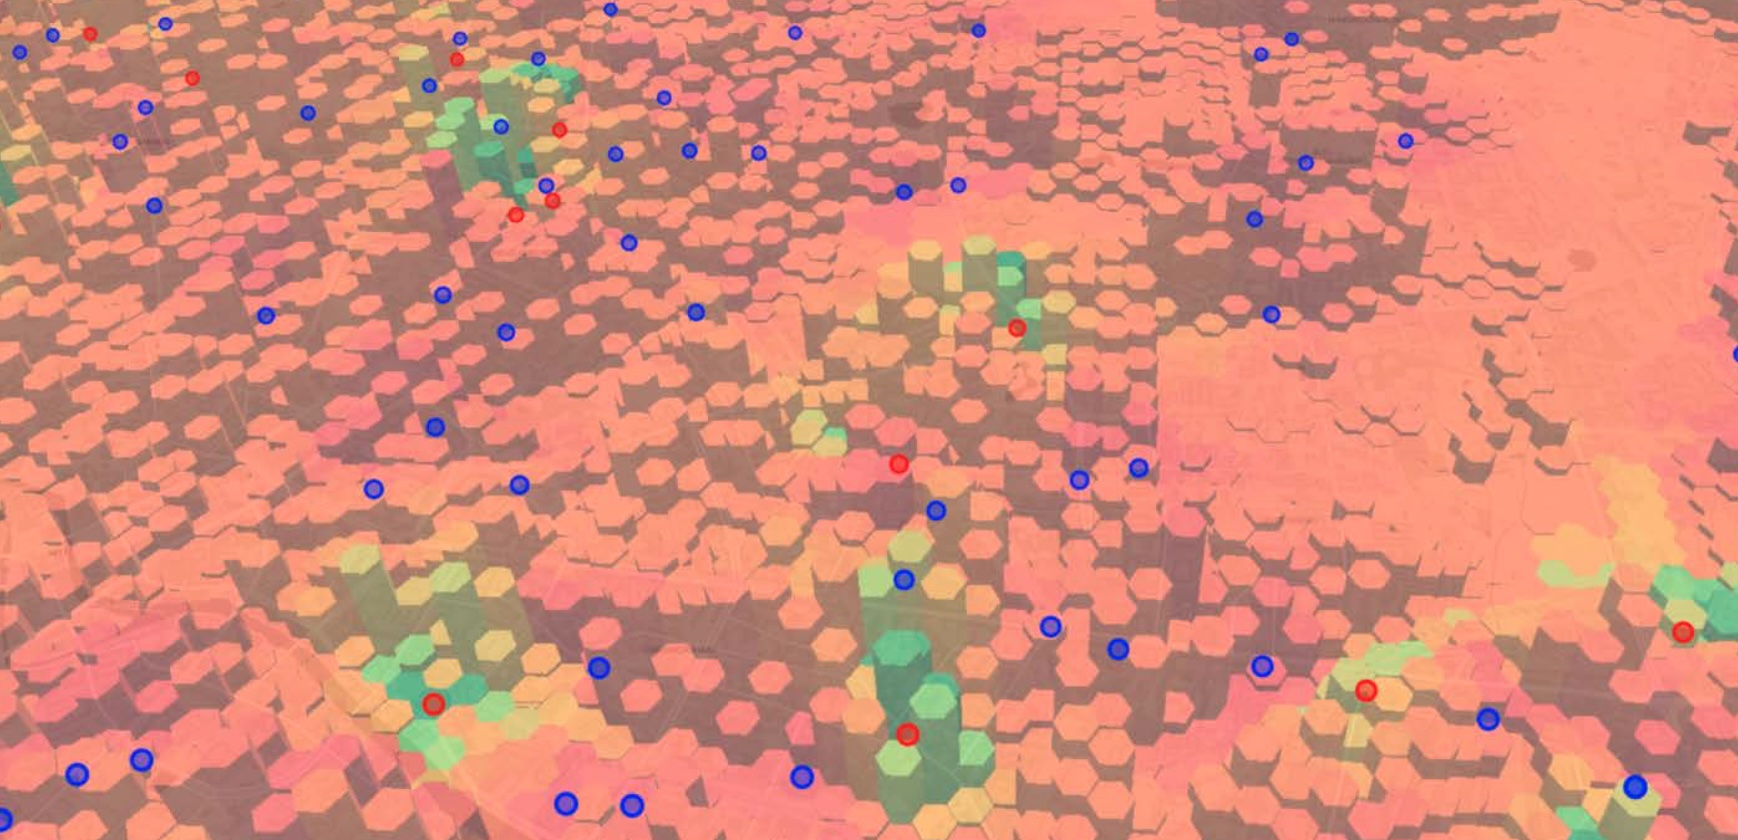
This enables us to quickly assess how many and which customers (based on age) each branch on the map attracts. As a consequence, Penny can now compare the predicted performance with the actual numbers from its existing stores. Upon these results, the gravity model can now be tweaked to represent the current situation as accurately as possible. After that iterative step, the discount supermarket will be able to determine the expected performance of potential new locations and easily identify the changes a new opening would cause to the entire retail branch network.
Key Takeaways: Data-Driven Retail Location Planning with Gravity Models
The real added value in leveraging data lies in its capacity to improve decisions and minimise risks. Through the application of gravity analysis, companies can benefit from an abundance of new insights applicable to both operational and strategic planning. Gravity analysis enables organisations to assess potential new retail branch locations in a cost-effective and data-driven manner. This process is reliable and generalizable, substantially supplementing extensive surveys or field studies—in some cases even rendering them superfluous.
In this whitepaper, we discussed in detail how travel time, attractiveness, and statistical data can be viewed as the main pillars of gravity analysis. We further presented how the integration of additional data sets, such as movement data, can significantly improve the predictive power of the model. Most notably, the ability to test the first computational results against the real proprietary business data on sales and transaction numbers plays a decisive role in refining and adjusting the parameters of the model, which then, in turn, becomes more realistic and dynamic. Within this process, state-of-the-art AI and machine learning techniques, like our GeoAI model, can be exploited to process enormous amounts of data, especially when large retail branch networks are involved. While gravity analysis is not a new concept, we are convinced that these emerging technological opportunities are opening up entirely new possibilities for businesses.
You May Also Be Interested in