

APIs to map thousands of POIs can slow down or crash your system. Targomo’s new service solves this issue by using vector tiles in the MVT format, in addition to clustering. We will explain how these features work and how you can access them.
Visualizing POIs as Vector Tiles
As with many other Points of Interest APIs on the market, our previous version was at times slow to visualize all the data on a map, especially when selecting a large area (zooming out). Furthermore, we previously only offered the possibility to request POIs in JSON format. That made the integration of our POI service difficult as one needed first to parse our service JSON response in order to add it into one’s application.
To remove these hurdles, we’ve created a new request method to our API which gives you the possibility of retrieving POIs in the MVT format. It is a machine-readable data specification that can be integrated into various map applications such as Mapbox GL JS. These applications divide your map into smaller parts or tiles and request the needed information for each tile. Adding the possibility of requesting the POIs as MVTs provides you a faster, more reliable and responsive visualization of them on your maps. We’ve used this technique to build our interactive POI tool, launched in December.
The request is quite simple to configure inside your map application. All you need to do is to set the “MVT request” URL as tiles source. For instance, a GET request URL that enables you to visualize the POIs that contain the tags amenity=restaurant and shop=clothes looks as follows:
We also have a full code example with Mapbox-GL on our developer website, showing cafes, bars and banks.
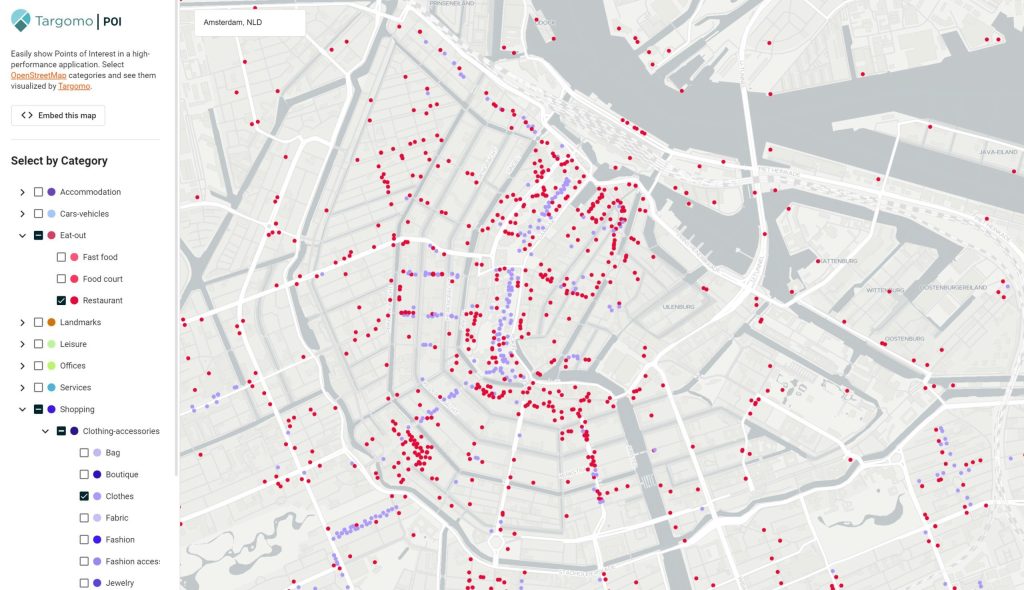
The Targomo POI tool above uses the techniques described in this article. Click and drag the map or zoom in to see a specific location.
How to Write Your MVT Requests
As you may have seen in the example above, you must define which OpenStreetMap tags you want to search for in the request URL. Indeed, an OSM tag is composed of a key and a value (defined with the syntax “key=value” in the request). To make our service as fast and user-friendly as possible, we have limited our API to 16 OSM keys, which are similar to categories. These keys (such as shop, amenity, tourism, office) are the ones we found relevant from a “Point of Interest” perspective. There is no need to request OSM objects according to their landuse tag for example. The list of supported keys is available via this request: /pointofinterest/osmTypes.
To further aid performance, the number of OSM tags that you can request drops when you zoom out. Starting from zoom level 7, the more you zoom out, the fewer OSM tags you can request at once.
The request has two other features. First, it is possible to request all the values at once for a given key by using a wildcard, the asterisk sign “*”. The following request, for example, would render all types of shops on a map:
/pointofinterest/{zoom}/{x}/{y}.mvt?apiKey=yourAPIkey&shop=*
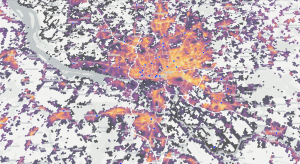
Secondly, you can request the POIs as hexagons instead of nodes thanks to the parameter layerType. Supported values for this parameter are: node or hexagon. This might be helpful as a background layer of POI density in a city.
Another useful tip: If you want to know which information is retrieved by our MVT request, you can replace .mvt (which is only machine-readable) by .geojson to get the result of the request in the human-readable GeoJSON format and hence debug your application more easily.
Clustering: Having a Quick Glimpse of All POIs When Zooming out
For wide areas such as entire cities or countries which contain a lot of POIs, the amount of data that needs to be displayed on the map can get huge very quickly: displaying all of the bus stops (highway=bus_stop) in Germany represents 313k points for example. It can jeopardize the performance of your application. Furthermore, loading thousands of points on a single map with a big zoom-out level is useless as many of the points are very close to each other. There are not even enough pixels to distinguish them.
To improve the loading time and the MVT response size, our API service clusters the POIs. In other words, it slices the requested tile in multiple, very small areas and gathers the POIs that are in the same area. It only retrieves then one point per area with the mean coordinate of the POIs and the number of POIs that it contains (thanks to the attribute numOfPois of the point).
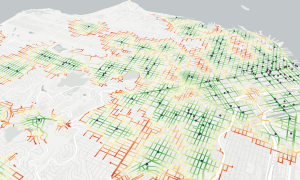
Clustering allows us to generate a quicker overview of the POIs located in a large area and improves the readability of the map by aggregating several POIs into a bigger marker. Zooming in still gives the user all the data points he or she wants to display, as shown in the illustration below.
From far away, POIs are clustered and displayed as large dots when they are
close to one another. Zooming in reveals that a big dot represents several POIs.
Requesting Similar POI Tags Easily Thanks to Our Hierarchy
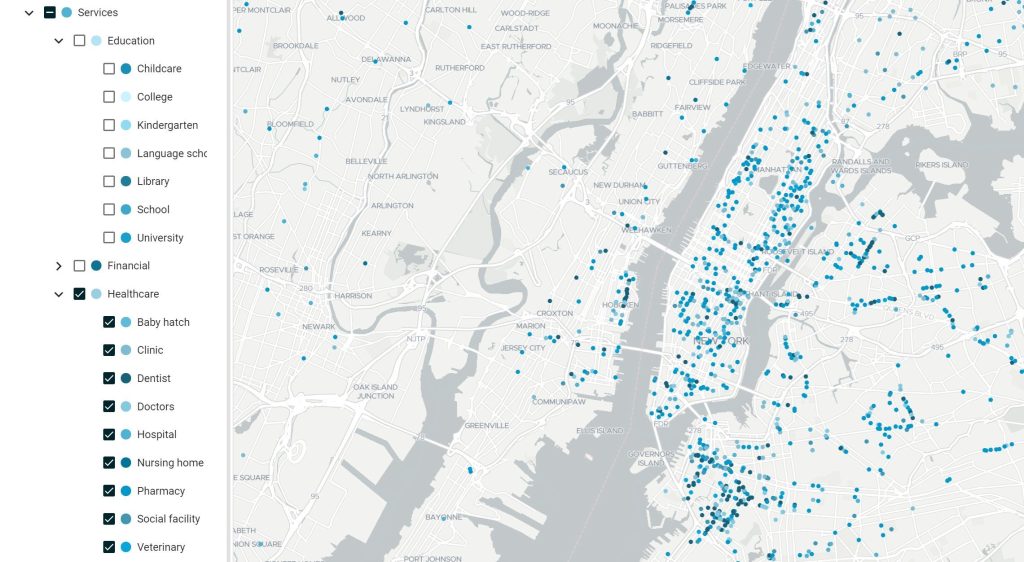
It is sometimes quite tedious to find all the OSM key/values you need to visualize. For example, if you’d like to display all the places where a health care service is provided you need to look at the OSM Wiki and produce the exhaustive list of the OSM tags that correspond to a healthcare service: doctors, clinics, hospitals, dentists, pharmacies, and so on.
Our API and tool make your job easier thanks to a POI Hierarchy. We have built a hierarchical classification of POI tags that allows you to directly request a group of related POIs.
For example, instead of requesting
amenity=pharmacy&amenity=hospital&amenity=doctors&
 amenity=dentist&amenity=clinic&amenity=social_facility&
 amenity=baby_hatch&amenity=nursing_home&amenity=veterinary
you can retrieve all these items with the ID of the group health care. The request will be then:
 Our POI hierarchy makes it easy to display related POIs.
The definition of all the groups of the POI Hierarchy can be found with this request:
The result of this request is a JSON array with a tree of POI groups. Each POI group can either be a category that contains one or several subgroups or a simple POI tag with a key and a value. For example, the group “Services” with the ID g_service is composed of 4 subgroups, including the group “Healthcare” (g_healthcare), which itself is composed of 9 simple tags such as amenity=hospital or amenity=doctor.
Feel free to give us some feedback if you think some OSM tags are missing in our POI Hierarchy. We would be happy to enhance it thanks to you!
Requesting POI Information
In the MVT response, the POI tags (such as “source”, “opening_hours”, or “addr”) are not all retrieved to reduce the size of the response and hence increase the loading speed of the map.
However, after displaying all POIs in a certain area for a given group, you may need to get all the OSM tags of a certain POI. Thanks to our info request, it is easy. You can make this request as follows:
/pointofinterest/info/{poiID}
It will return all OSM tags that this OSM object contains (such as its name, address, or opening hours) and all the groups which this POI belongs to.
Added Value: Combining the POI Service with Our Other Features
To truly unlock the power of POIs, you could combine our POI service with our routing service. We could, for example, request the POI from a certain group and request the travel time between these POIs and a given source. This would allow us to calculate the travel times from an office building to public transport stops within a 10-minute walking distance, for instance. On our developers pages, we offer an example of how you could achieve this.
We are excited to learn how you will use our new POI service. Please drop us a line on our contact page. To get started, click on the icons below. Happy coding!
Integrate Targomo’s tool into your application and
create a powerful way to visualize POI data.
Check out our POI tool
Map data © OpenStreetMap contributors