


“Find out how we used Isaac Newton’s Theory of Gravitation to answer a complex location based question: Why are so many Berlin parents struggling to find a Kindergarten place for their children? We found that Kindergartens throughout the city are unevenly distributed.
Since 2018, every child in the German capital is entitled to free child care from their first birthday onward. Still, this new law has not solved the problem that has become very common among young parents. The threat of “Kita-Notstand” (“Kindergarten Emergency”) has recently made headlines. It threatens the attractiveness of Berlin for young parents and newcomers. And here at Targomo we have also felt this problem. After all, we are a young company and some of our co-workers just had children and some are struggling to find a place for their child.
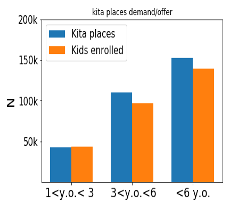
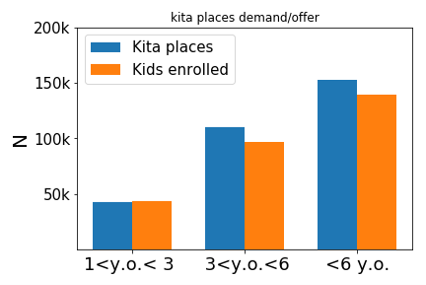
We were wondering: What is the story behind the Kita-Notstand? Is there maybe something we are missing here? As a first step we decided to look at the demand and supply of Kita places and it looks like there are enough places for children in the German capital. In total 139.856 kids are enrolled in Berlin’s Kitas today and the whole city offers 152.559 Kita places (destatis.de, kita-suche.de).
So we asked our data magician Jacopo to further examine the problem from a location intelligence perspective. We assumed that the locations of Berlin’s Kitas were suboptimal. To test this idea he used a concept based on Newton’s law of gravitation particularly helpful in solving this puzzle.
Newton’s law of gravity says: “every mass attracts every other mass in the universe, and the gravitational force between two bodies is proportional to the product of their masses, and inversely proportional to the square of the distance between them.” In short: The gravitational force between two bodies gets smaller, the further apart they are. And larger bodies have a stronger gravitational force than smaller bodies.
Our model treats Kita locations as bodies that attract people. Larger Kitas attract more children. The longer people must travel to a Kita, the less they are attracted to it. With our gravitational model we can predict the number of kids applying to each Kita and thus their degree of overcapacity.
Very early in the process we decided to follow two strands of analysis. First, we wanted to see what would happen if parents chose the closest Kita to their homes? Second, what if all kids eligible for a Kita spot applied for it? How would this change the current picture?
Case I: What if Parents Chose the Closest Kita?
But in order to get the full picture we needed to focus on two crucial categories: Age groups and location. A Kita in your neighborhood is not helpful if it only serves kids older than 3 years, but your child is 2-year old. A Kita with a free space for your child that is situated at the other end of the city is similarly unrealistic.
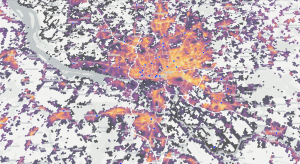
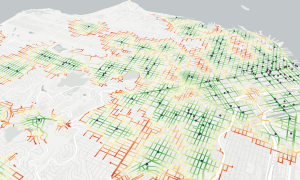
To understand the two factors better, let’s take a look at the following maps. The visualization of our gravitational analysis reveals the problems in the distribution of Kita places across the city. Black dots represent Kitas that are over capacity, meaning there are more Kids in its surroundings than the Kita can service. The size of the dots signifies the degree of overcapacity; how many children a Kita would have to accommodate to serve the demands of the parents living close by. Red dots equal 75% occupancy. Comparing these maps shows that the picture varies drastically between age groups.
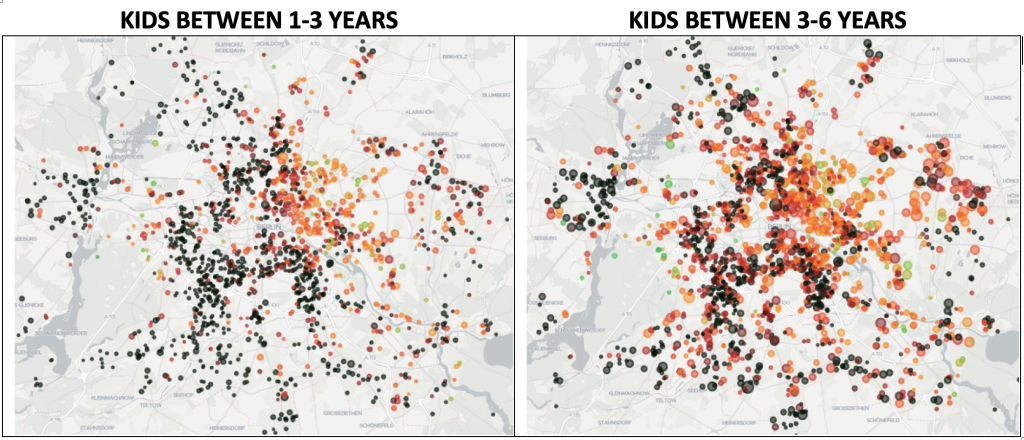
Kids younger than 3, especially in the South-West of the city, face a dire situation. For kids older than 3, there are enough Kita spots but there is a slight mismatch. Kitas in the East are on average only 75% occupied while Kitas in the West and at the outskirts of the city cannot serve all the children in their proximity. We calculate that 52 % of Kitas serving children between 1 and 3 years old are too small for the demand in their direct proximity. Or to put it differently, 48% of Kitas do not have enough children living in their proximity, that means that parents have to travel to these Kitas to find a place for their children. This situation is less dire for older children but still 30% of Kitas are over capacity.
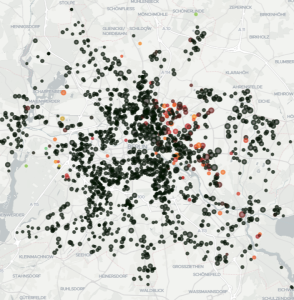
Case II – What if every Child Applied to a Kita?
In Berlin, every child over the age of 1 is entitled to a place in a Kita. The question we were asking is: what if every family in Berlin claimed their right to a Kita place? The result is dramatic. According to our census-based analysis, today about 35.000 kids in this age group who have a right to a Kita, don’t have access to a place.
The picture that emerges makes the problem crystal clear:
What’s next?
Children are the future. Providing equitable access to Kita benefits the entire community.
The reality on the ground probably resembles a state that’s somewhere in the middle of the two cases we considered. Giving easier access to Kitas in close vicinity to parents homes would incentivize more parents sending their children to a Kita. On the other hand, we know that not every parent will send their child to the Kita for a variety of reasons. But nobody wants a world where parents are forced to quit their jobs because the only available Kita is too far away from their home.
We understand that there are many more layers of complexity to any public policy decision that make running a city that much more complex. But we believe that visualizing the scope of the problem is incredibly powerful as a starting point for policy. With our Location Intelligence solutions, we give decision makers a platform to make decisions that are informed by data and state-of the art technology.
The study was presented by Jacopo Solari at the Urban Mobility Sympoisum – Karten, Daten, Geovisualisierung on 11. Oktober 2019 at CityLAB Berlin, organized by Technologiestiftung Berlin, supported by Senatskanzlei Berlin.