


Introducing Cannibalization Analysis: Examine the Impact of Competitors and Network Branches on Catchment Areas
We’ve released a major update of our location analytics platform TargomoLOOP: Businesses can now examine whether a new branch would cannibalize the catchment areas of existing locations. They can also see how rival locations could affect the potential customer base of own branches in the same area.
In the retail industry, for example, branches of the same chain sometimes compete against one another when they are located close to each other and catchment areas overlap. This effect is known as cannibalization, but the same principle also applies to the impact of competitors nearby.
All these surrounding locations have an effect on the number of people that is expected to visit a store. Calculating the impact of these locations is now possible in location analytics platform TargomoLOOP with a new feature called – surprise, surprise – cannibalization.
When cannibalization matters for business
Although reality is more complex, the assumption behind cannibalization analysis is that a person only visits one location and is not counted twice or more when catchment areas overlap. Cannibalization analysis is especially relevant for the uses case where a consumer only buys products in either shop A or shop B. It also applies to the business of micro fulfillment centers, for example, when online grocery shops instantly deliver goods to the buyer’s home, or when restaurants bring their meals to people living in the immediate vicinity.
In all these cases, a business does not want catchment areas of shops, delivery centres or restaurants to overlap, because that would lead to an oversupply of locations and higher operational costs. Or it would lead to a significant loss of potential customers when rival chains are located in the same area, but customers only care for visiting a single chain, for example, Do-It-Yourself Center A or B.
By considering cannibalization, a manager gets a more accurate picture of a location’s true catchment area. If a shop owner wishes to open a new branch, she can immediately see whether that new store would “steal” potential customers from existing shops in the same area and how many. She can also see how many customers she potentially could win from competing shops nearby. Or, conversely, how a competitor’s new location might impact the catchment area of her branches in the same area.
The new feature will help businesses and organizations to make better analyses of their locations and, ultimately, make better decisions about opening a new branch, relocating an existing one, and responding to competitors.
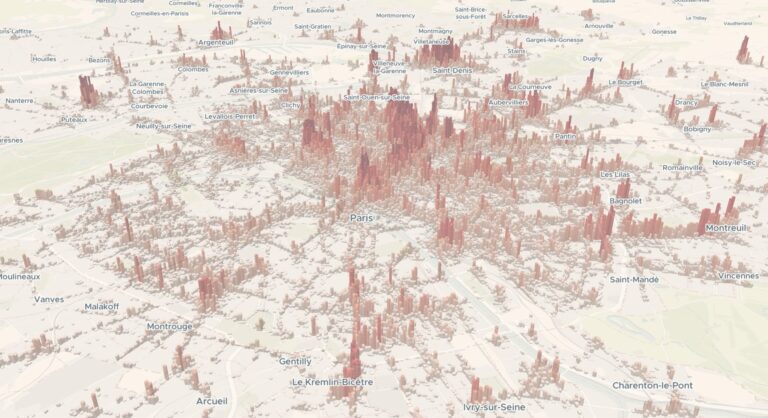
Catchment areas and cannibalization: An example
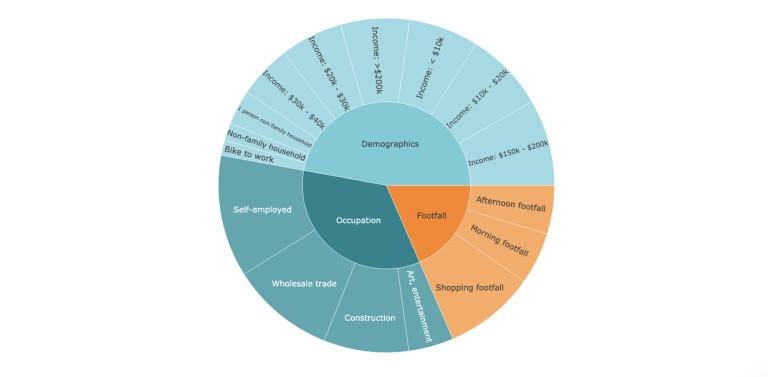
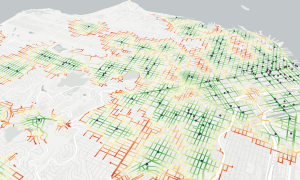
All types of data can be used to calculate a location’s catchment area, and therefore, the impact of cannibalization. TargomoLOOP offers demographic data, such as total population, household size and age groups, people categorized by spending power, and visitors data, for example.
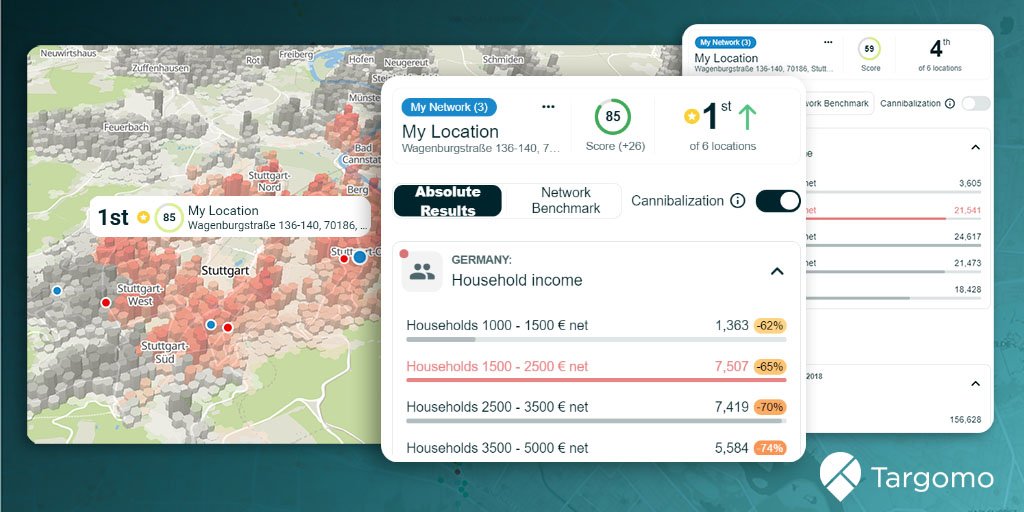
Let’s take the example of two supermarket chains, which each have 3 shops in Stuttgart. Their customers typically travel a maximum 10-minute car ride to the store. In the analysis below, when cannibalization is not considered, the shop that attracts the most people is My Location C. However, when the feature is turned on, Competitor Location B comes out first.
In TargomoLOOP, making the analysis is as easy as turning on the light: You only need to switch the cannibalization toggle to ON in the top-center of the table. Your results are calculated on the fly and shown in the table. For more information about how to use the feature and interpret the data, check our help pages.
How cannibalization analysis works in TargomoLOOP
For consumers, the travel time to a location and the attractiveness of that location – defined by, for example, the products on offer, opening hours, and the presence of other shops – determine whether they visit that place or a different one.
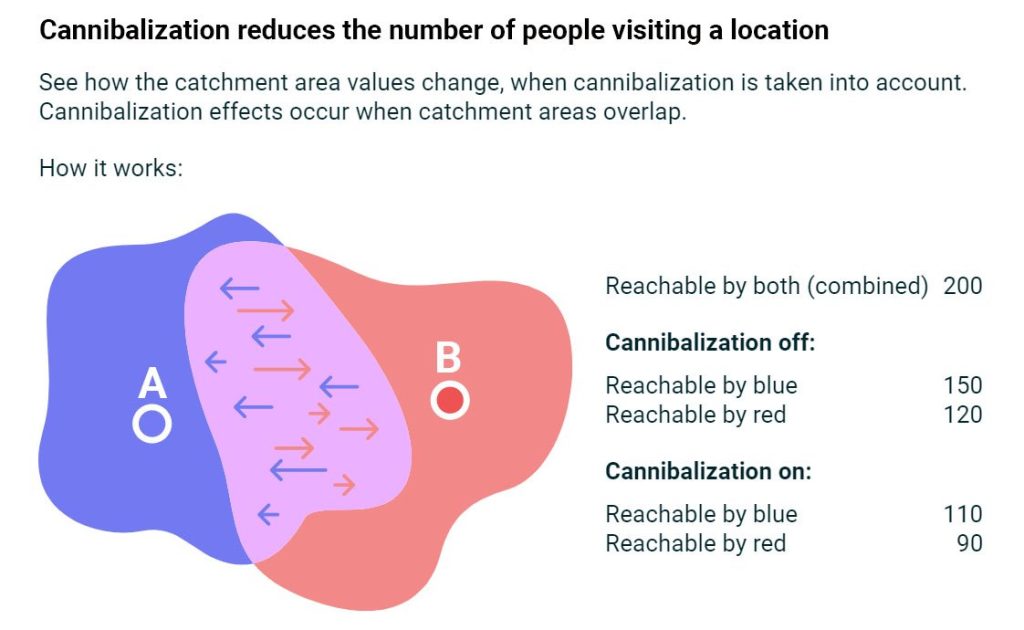
TargomoLOOP’s cannibalization feature uses travel time to calculate whether a person visits shop A or B, as shown in the picture 2 above. A person is expected to visit the location that he can reach in the shortest amount of travel time, given the selected travel mode. In the future, we also plan to introduce the option to take the attractiveness of a location into account.
The cannibalization analysis is based on a scientific method to predict the likelihood that a person visits a certain location. Newton’s law of gravity, which states, among others, that the gravitational force between two bodies is inversely proportional to the squared distance between the two bodies, is taken as the basis of the calculations. But instead of taking distance, travel time is taken as the variable determining whether a person “gravitates” to location A or B. Anyone interested in the methodology can check our whitepaper Selecting the Ideal Branch Location with Gravitational Models.
Many businesses and organizations, from retailers to restaurants and bakeries, from real estate to mobility services, can benefit from TargomoLOOP and its features. They can make detailed analyses of locations, catchment areas, and neighborhood characteristics.
You May Also Be Interested in