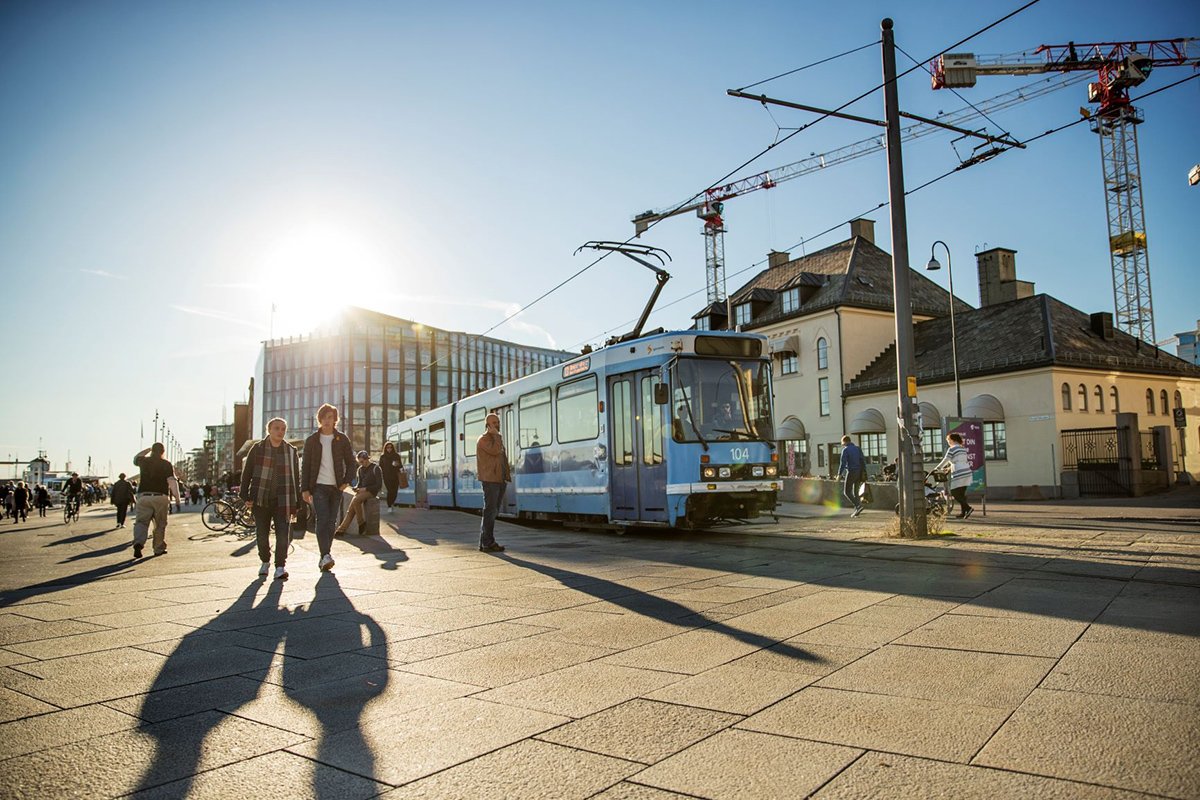
Picture source: Redink Thomas Haugersveen / Ruter
Oslo’s public transport authority Ruter uses location intelligence to easily analyze the impact of network changes and to win support from politicians and commuters. With TargomoLOOP, Ruter can quickly see how its network should evolve to serve more people, more efficiently.
Transit Authorities Face Many Challenges
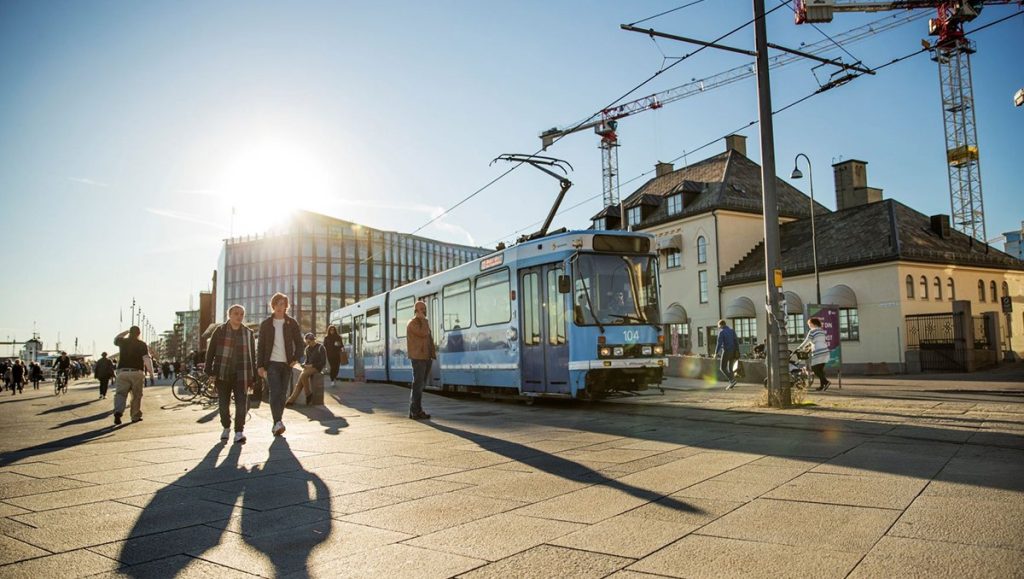
As in many big cities, the public transport authority in Norway’s capital has to respond to demographic developments, changes in the usage of transportation means, and constructions projects. In the Oslo metropolitan area, home to more than 1 million people, rerouting lines has a large impact: Ruter’s contractors handle more than 380 million journeys per year and operate around 250 metro, tram, bus and ferry lines.
The municipality-owned company turned to Targomo in 2015 to analyze the impact of new bus stops or redirected routes and determine the optimal number of stops on a line. Later, they also used the platform to find the best location for a new electric mobility hub, examine whether citizens can easily access newly developed areas, and define the potential market when changes or expansions are planned.
[quote text=”This platform helps us to provide the best transit system possible, and that is something the whole community and our customers will gain from.” type=”long” name=”Trude Flatheim” role=”Strategic Traffic Planner at Ruter#”]
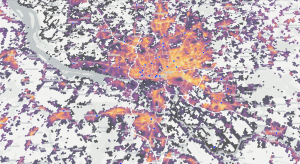
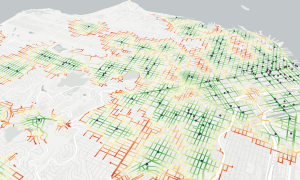
Ruter combines its own network and passenger load data with census figures in Targomo’s platform, which calculates the travel time to the nearest transit point from any place in the city. At an aggregated level, it shows how many people can reach a transit stop or any stop of a line within ten minutes on foot, for instance.
With these sophisticated, yet easy-to-use calculations, Ruter can quickly forecast the impact of network changes, analyze different scenarios, or examine the effects of a completely new line.
“It is much easier to see how many people are affected,” said Trude Flatheim, a strategic traffic planner with Ruter. “This platform is simpler than what we used to have. Everyone can go in there and make these analyses in a couple of minutes instead of hours.” Even people who are not skilled in using geographic information systems (GIS) can quickly get started. Flatheim and her colleagues can use the application every time when a network change is discussed and even show the analysis live to stakeholders.
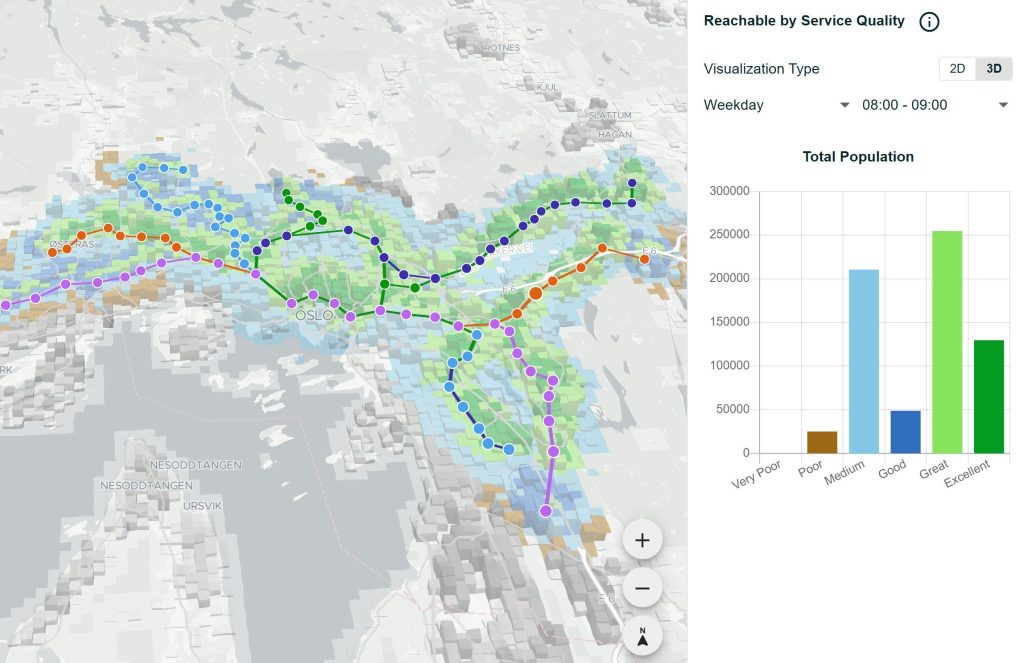 The blue and green shaded areas show which customers have decent access to Ruter’s five metro lines based on frequency and the stops’ reachability. Graphic source: Targomo / Ruter
Maps and Numbers Build Stronger Arguments
The platform helps Ruter to win support from commuters and politicians in the municipalities of the Greater Oslo Region to make network changes, whether temporary or permanently. In fact, people can better understand the results of the analysis because they’re visualized on a map.
For example, Ruter has used the results to explain to commuters why certain network changes made sense, even when these meant longer travel times for some travelers. “We have to make people see the whole picture; it all comes down to this cost-benefit analysis,” Flatheim said. “We have to do that all the time. It’s easier to show them when we have the maps and tools.”
The Mobility Needs of a City Are Rapidly Changing
Transit authorities need to analyze the potential of areas where new development, such as a new hospital, is planned. How many people could use the new location? How will they get there? Ruter is now able to plan and decide whether to offer more services in new areas even before construction has started.
Mobility behavior and policies also change, requiring novel initiatives. Together with the Norwegian Public Roads Administration and the City Environment Agency in Oslo, Ruter has used Targomo’s platform to find a suitable location for a new mobility hub, where people can pick up and share electric vehicles, bikes and scooters. The site is closely located to several bus stops. “It is a way how we think about arranging mobility in the future, offering new modes to move around in the city,” Flatheim said. The hub, part of an initiative to make Oslo a carbon-neutral city, was taken into operation in August 2019.
By incorporating new data sets in Targomo’s platform, Ruter’s forecasts become even more reliable and up to date. The transportation authority is currently testing mobile phone usage figures to make dynamic predictions based on citizens’ movements in the city throughout the day and week. These figures could accurately forecast when and where the need for buses, trams, trains or ferries would be biggest.
Targomo supports Ruter in offering a customer-centric network and responding adequately and timely to new modes of transportation as well as policy changes. Managing a highly complex network has become simpler.

