Data Explained
How Trusted Tourism Analytics Data Improves Site Selection

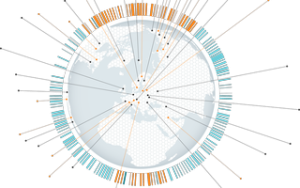


Analyse sites and assets in seconds with our platform, built for businesses with physical locations. Make the right investments and expand your site network strategically. Powered by 250+ datasets, enriched with your own, TargomoLOOP delivers tailored insights to help you make informed business decisions.

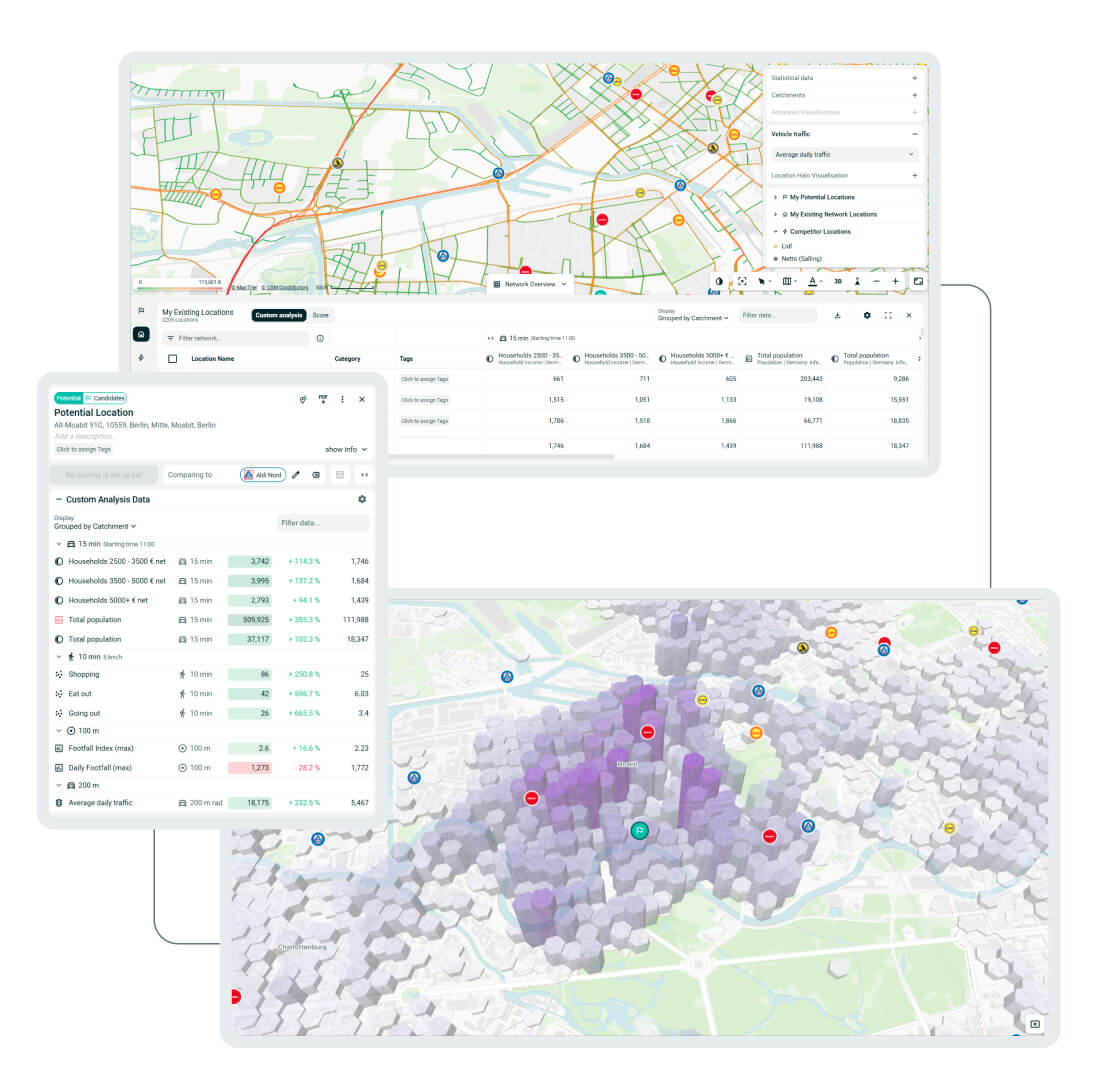
Manage your entire site network and business environment across cities and countries within a single platform.

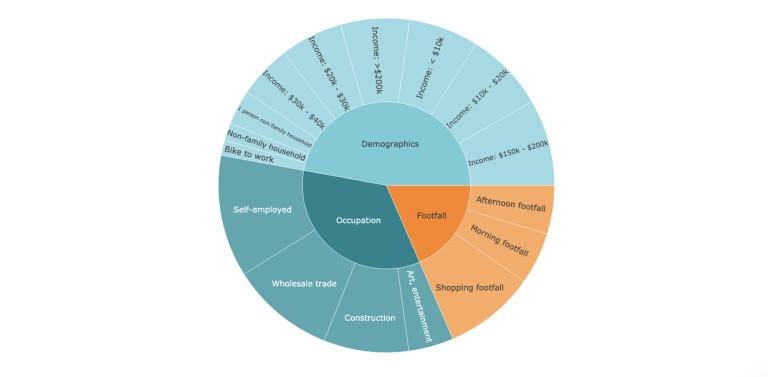
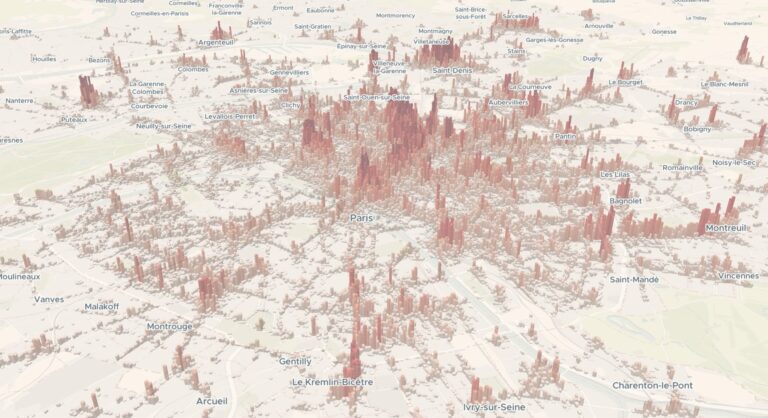
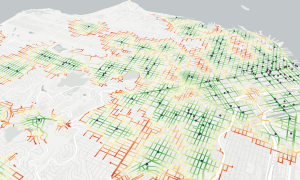
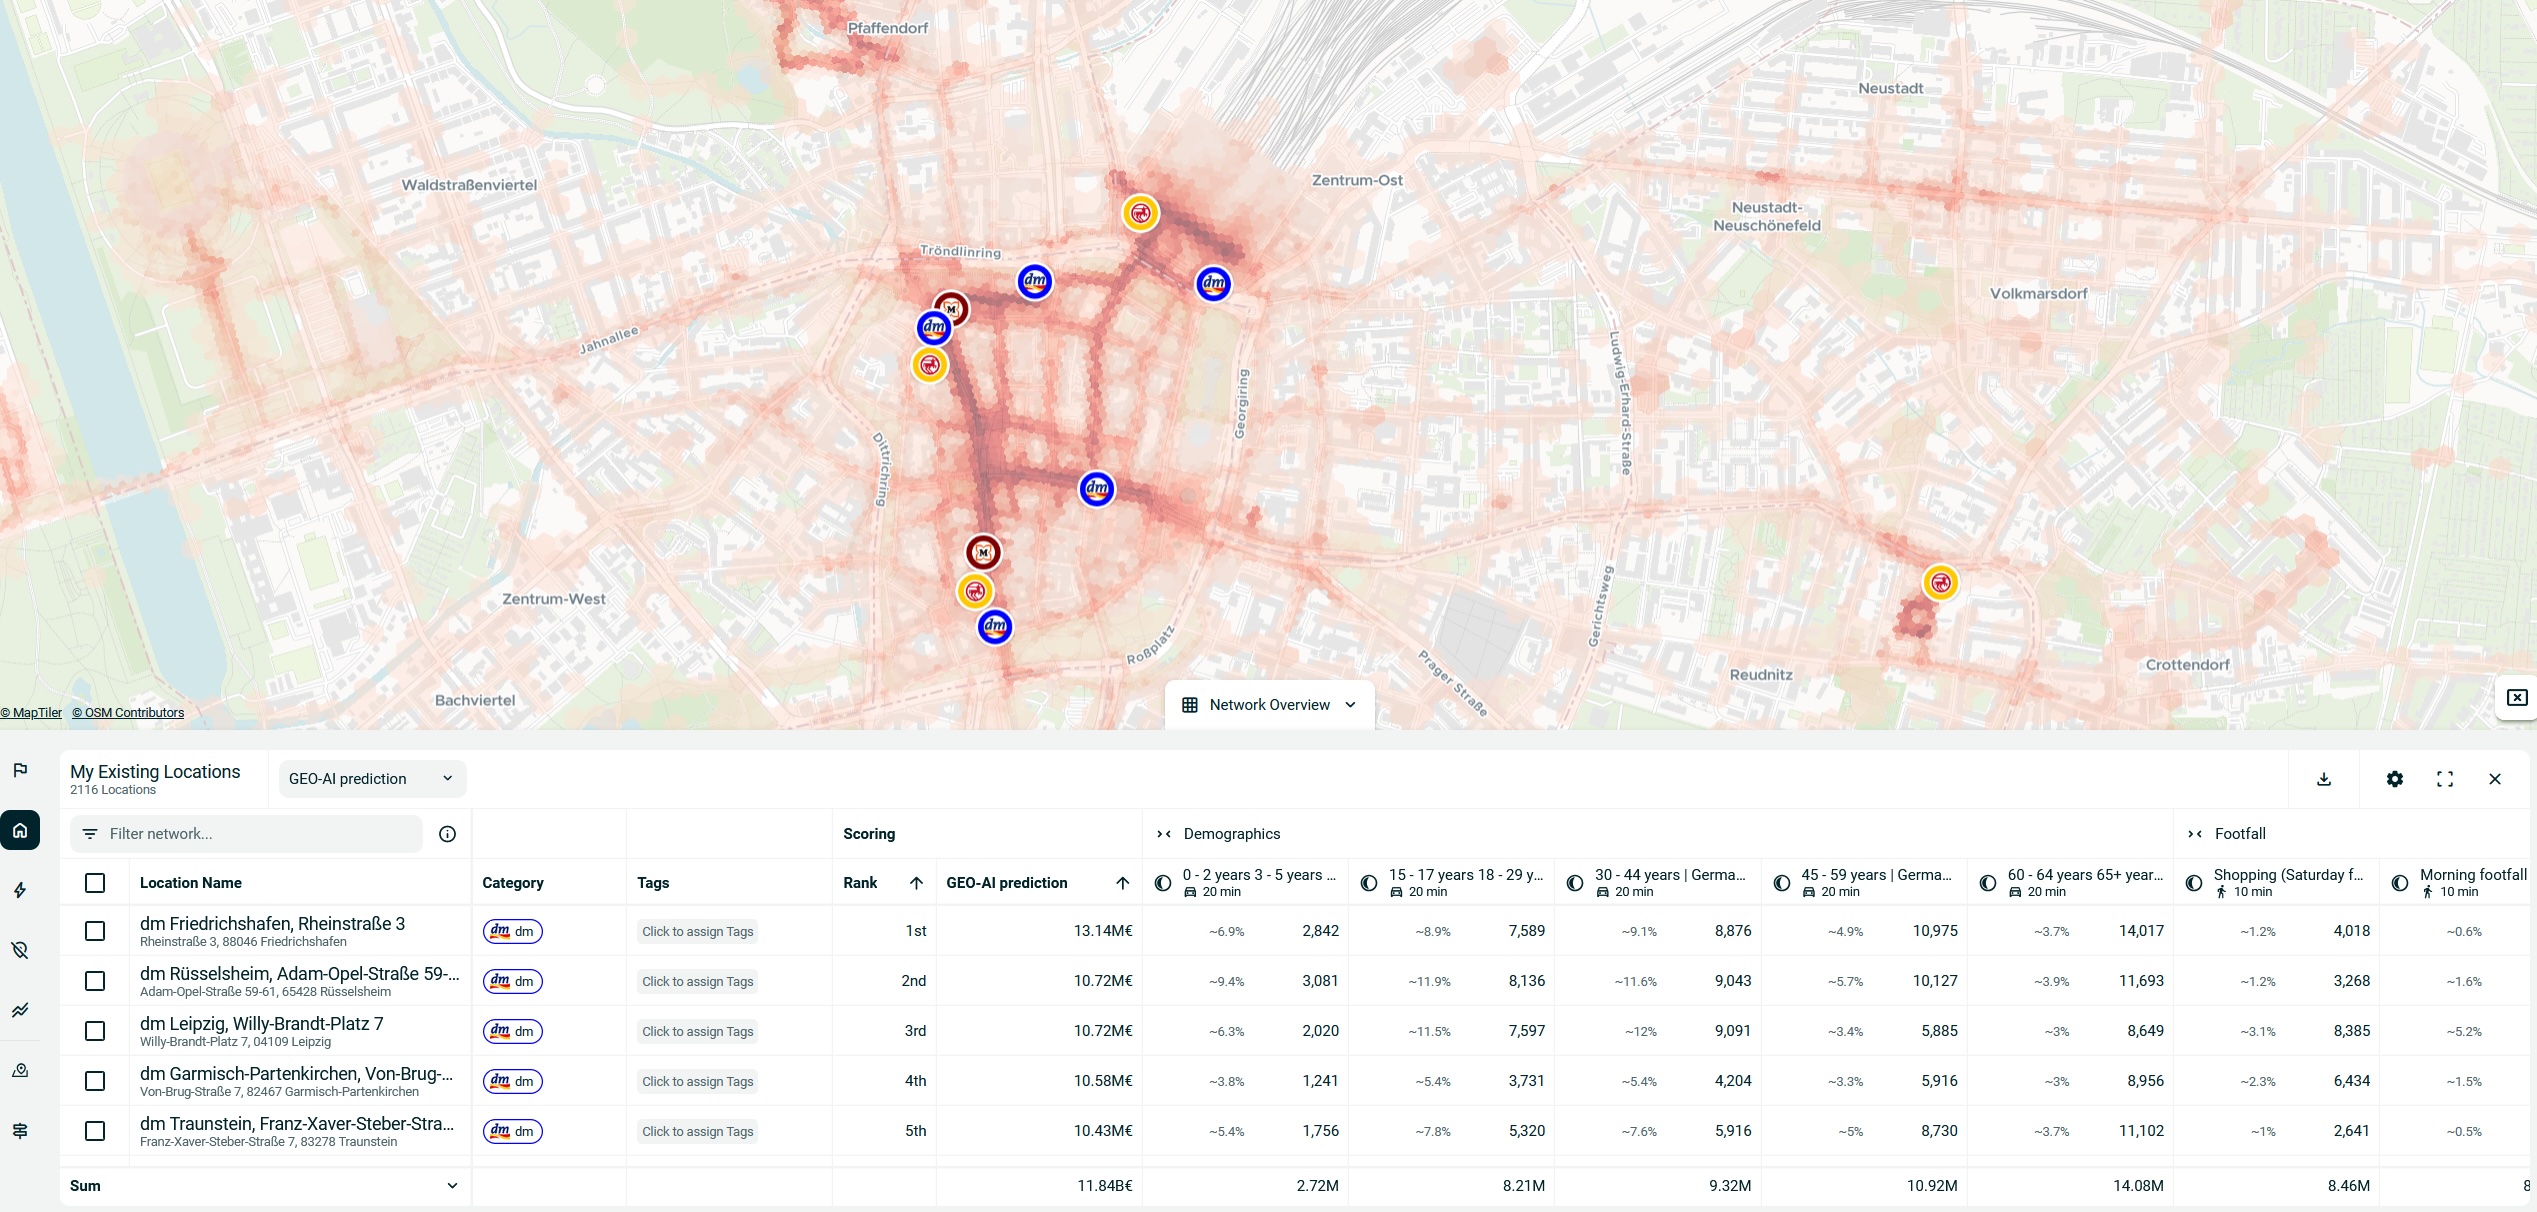
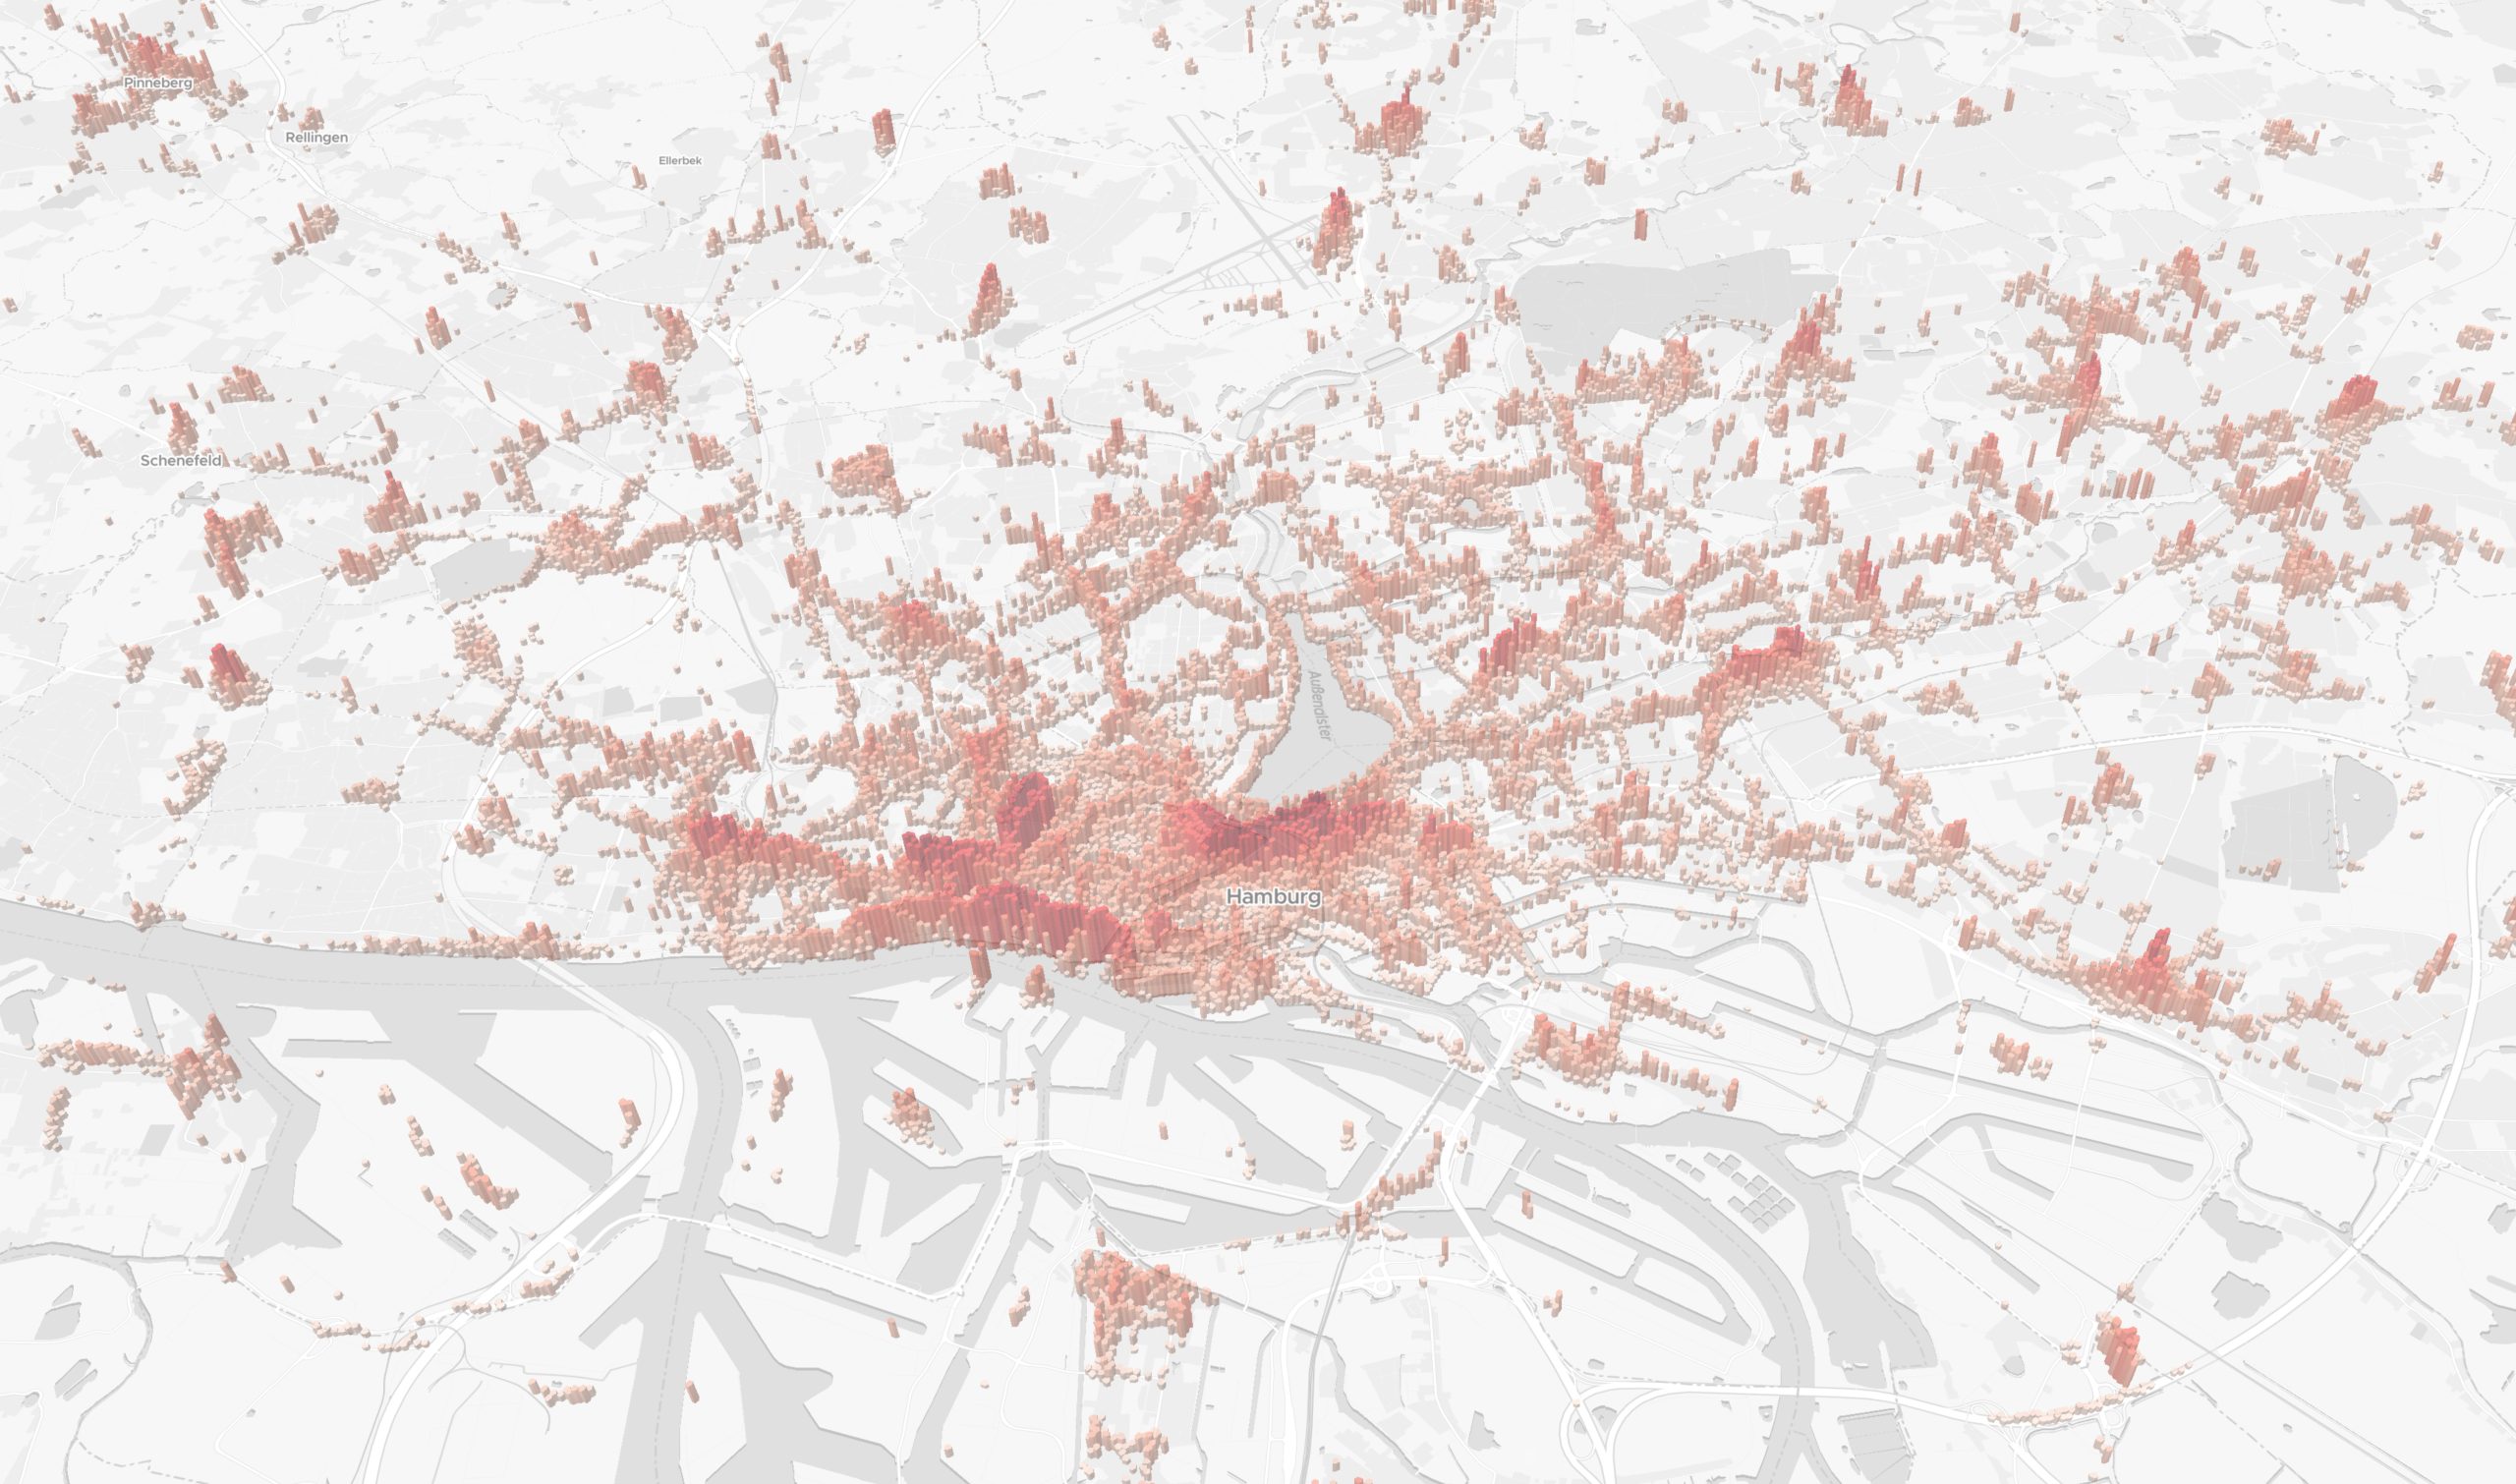
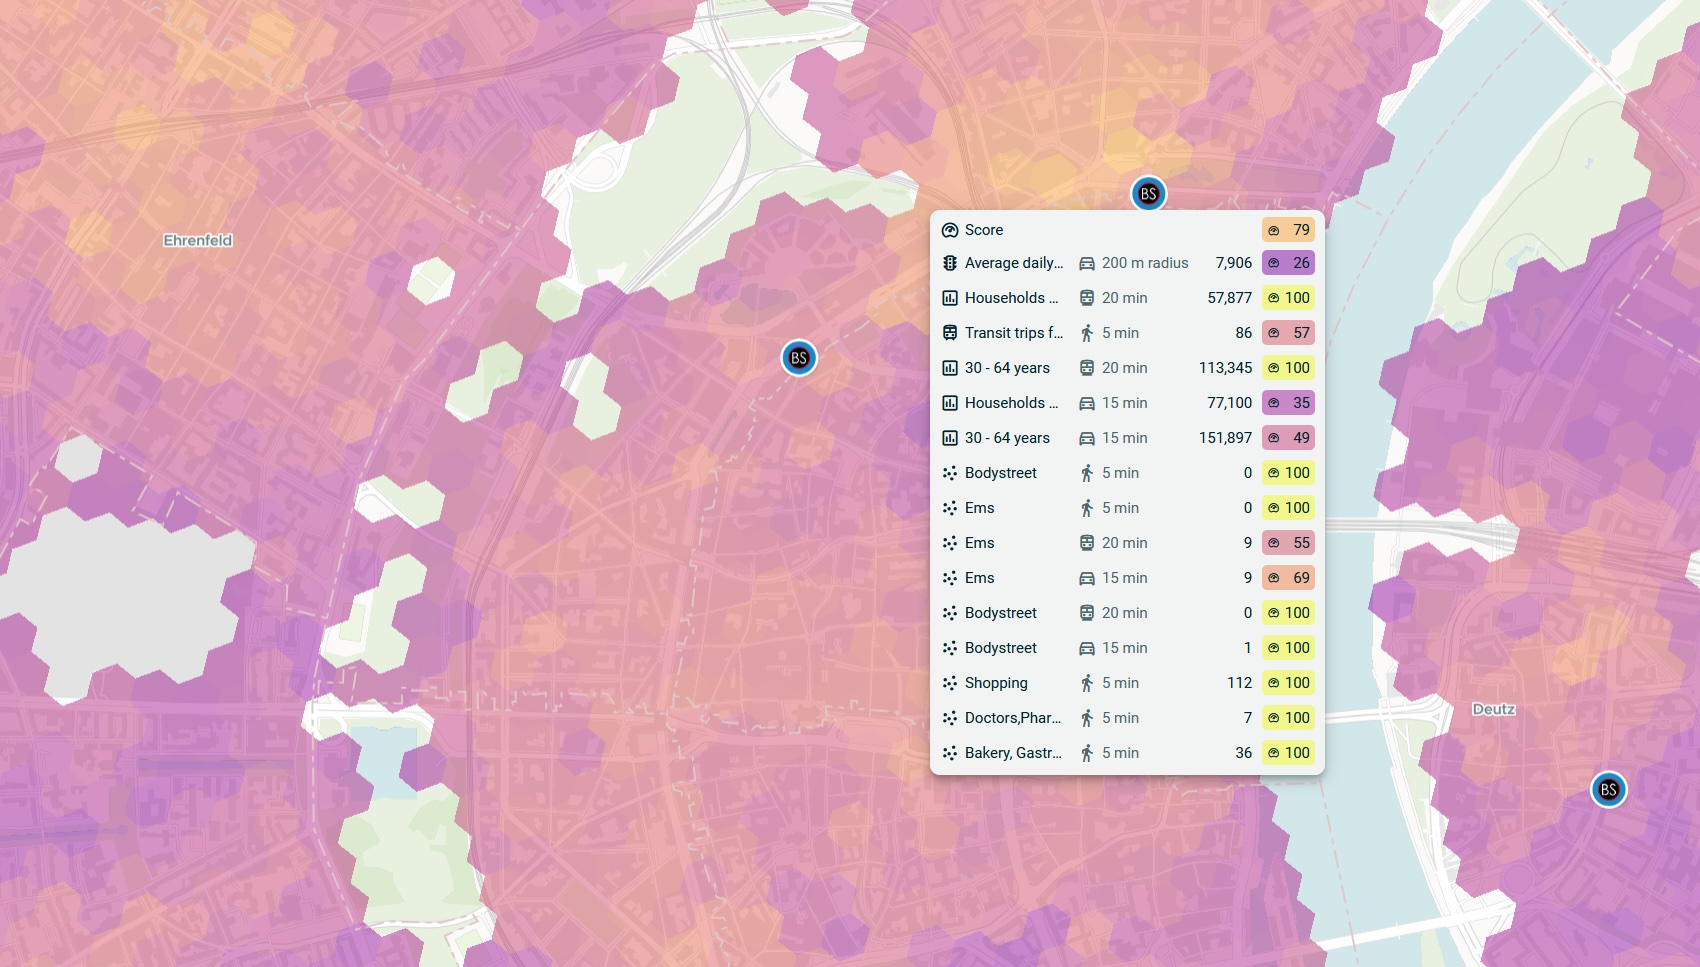
Access the latest demographic data, highly granular footfall insights, vehicle traffic, POIs, and more.

Integrate your data with external sources to uncover actionable insights tailored to your business.
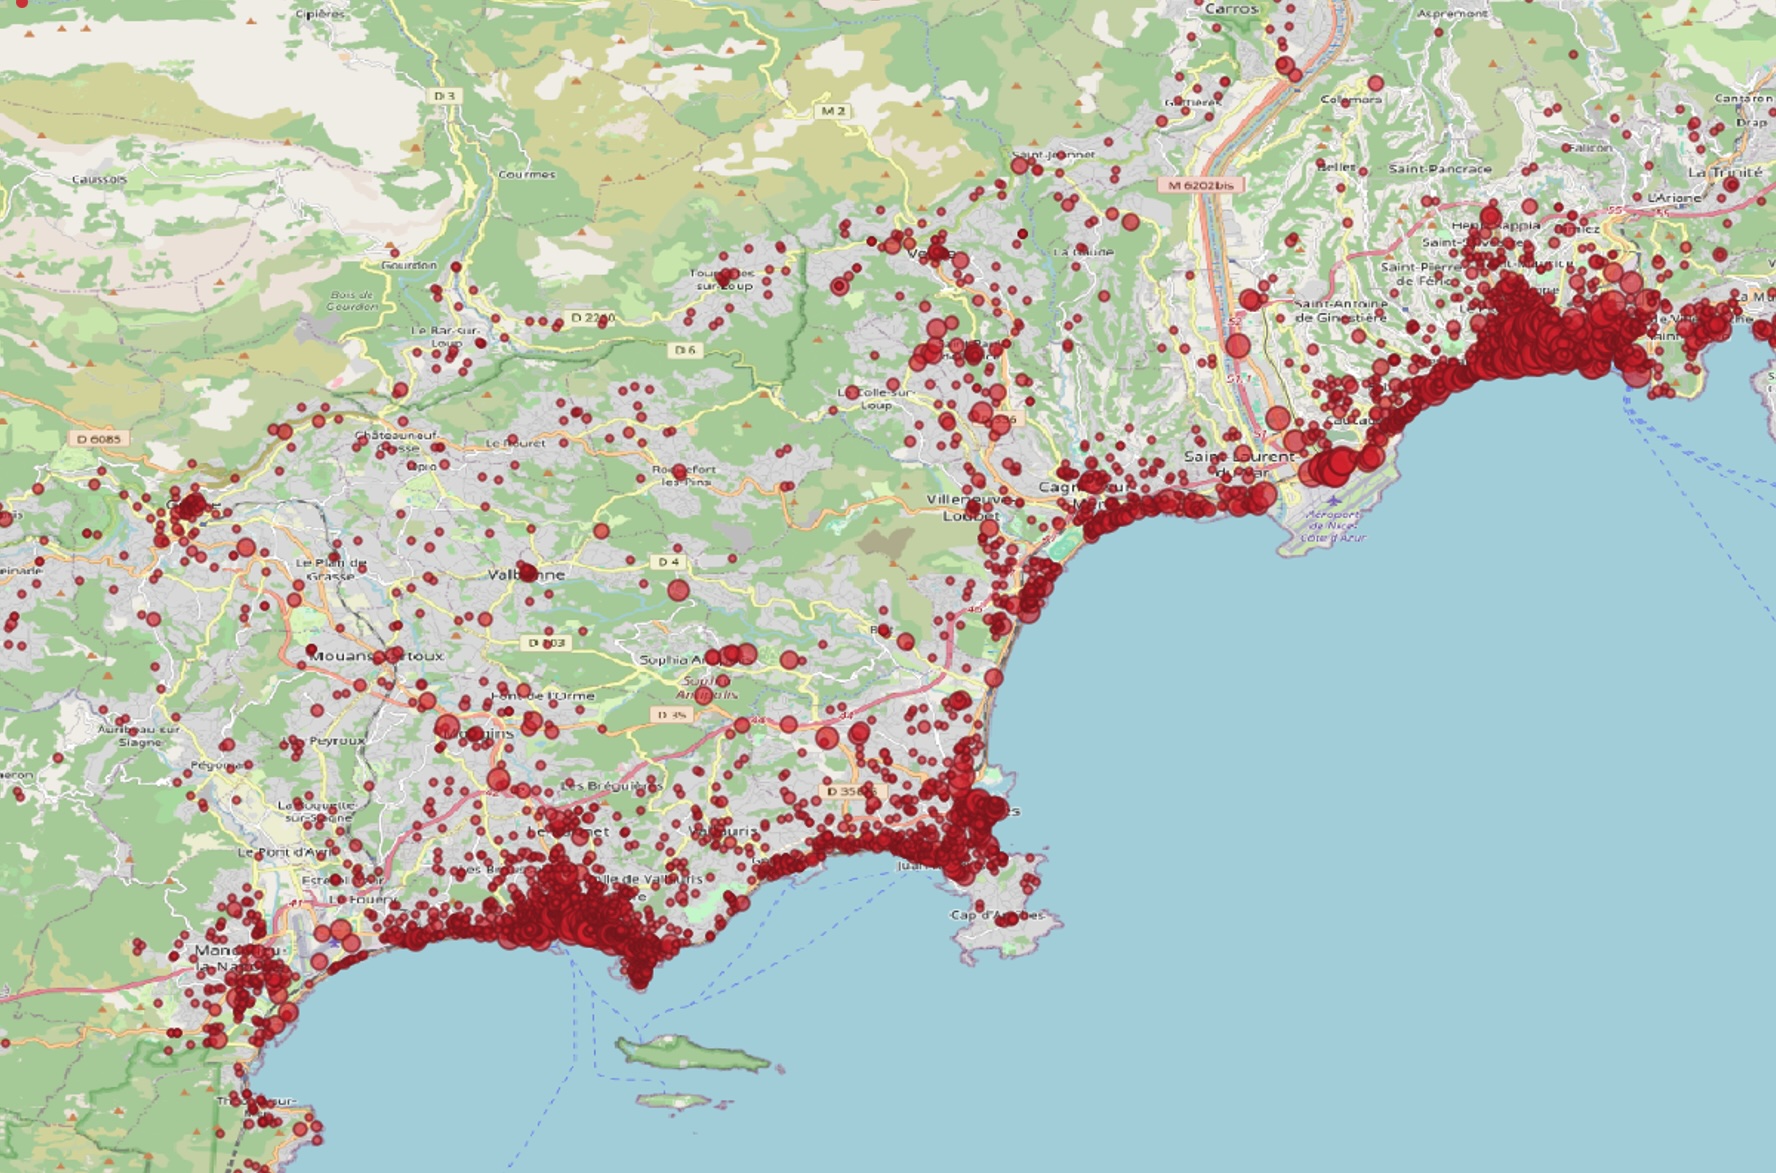

Assess competitor locations, identify key POIs, evaluate growth, and minimise risks when expanding your network.
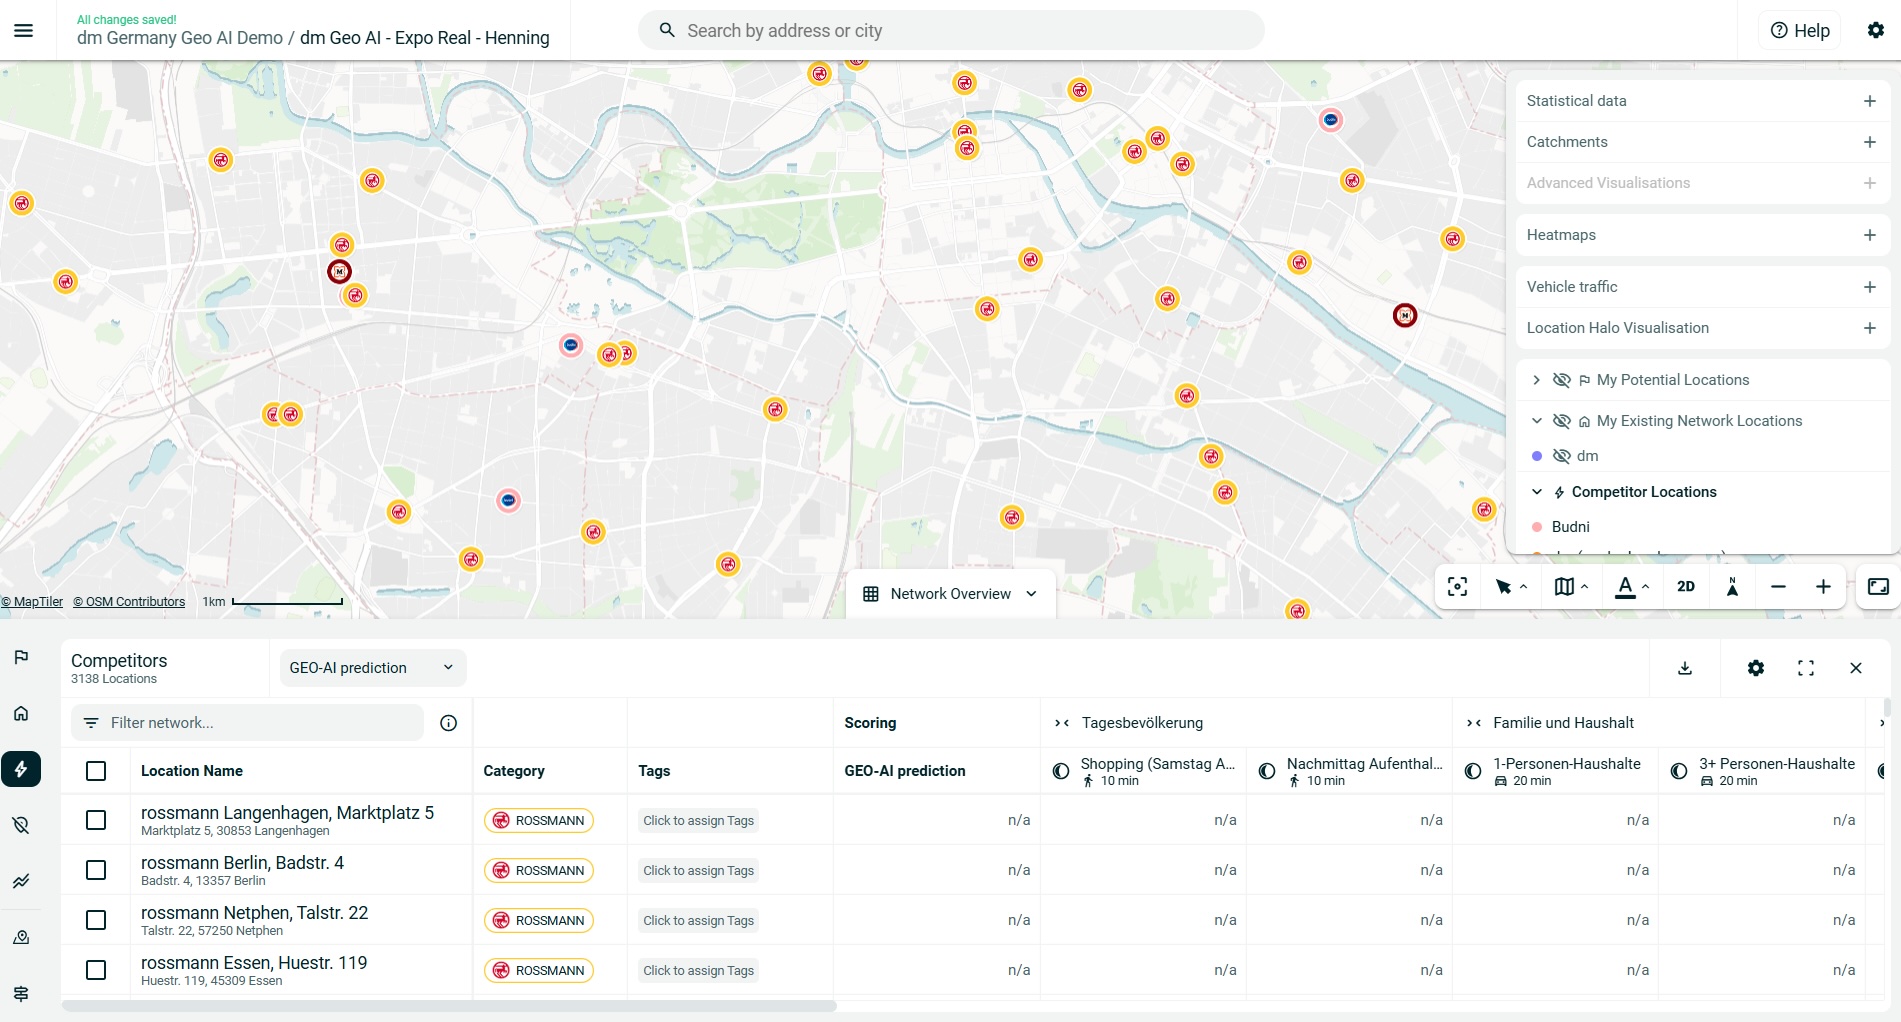
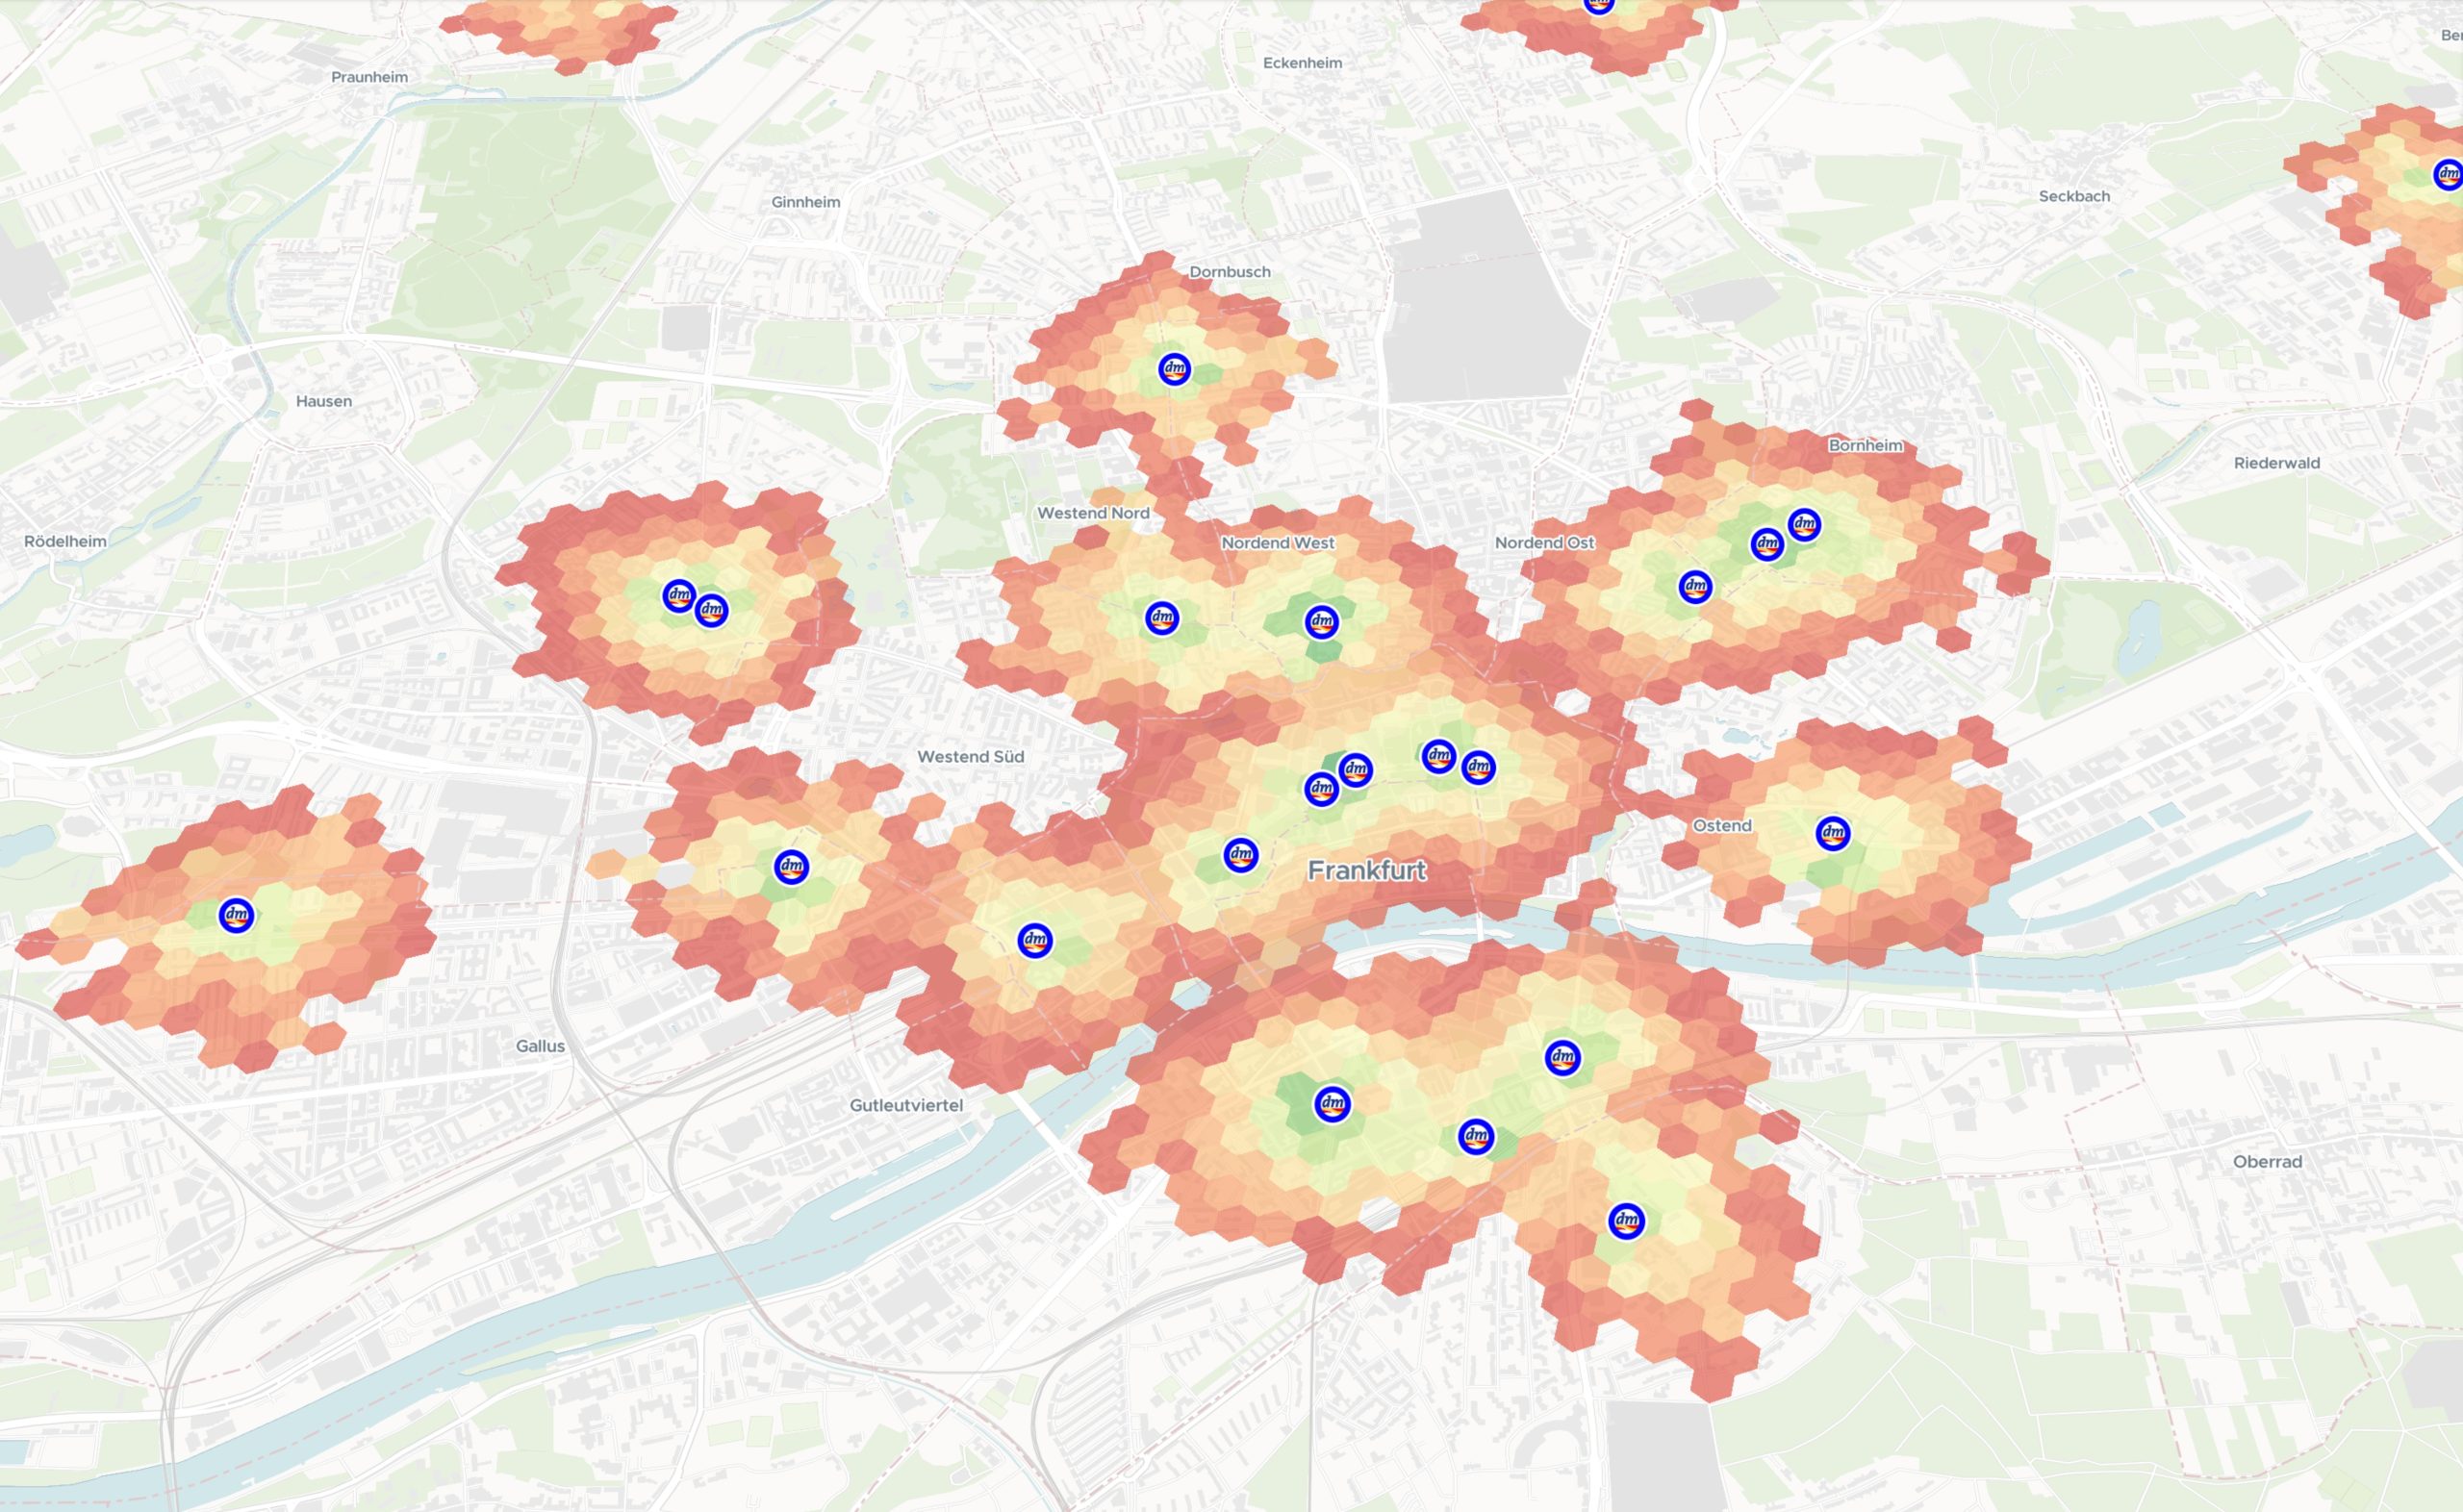

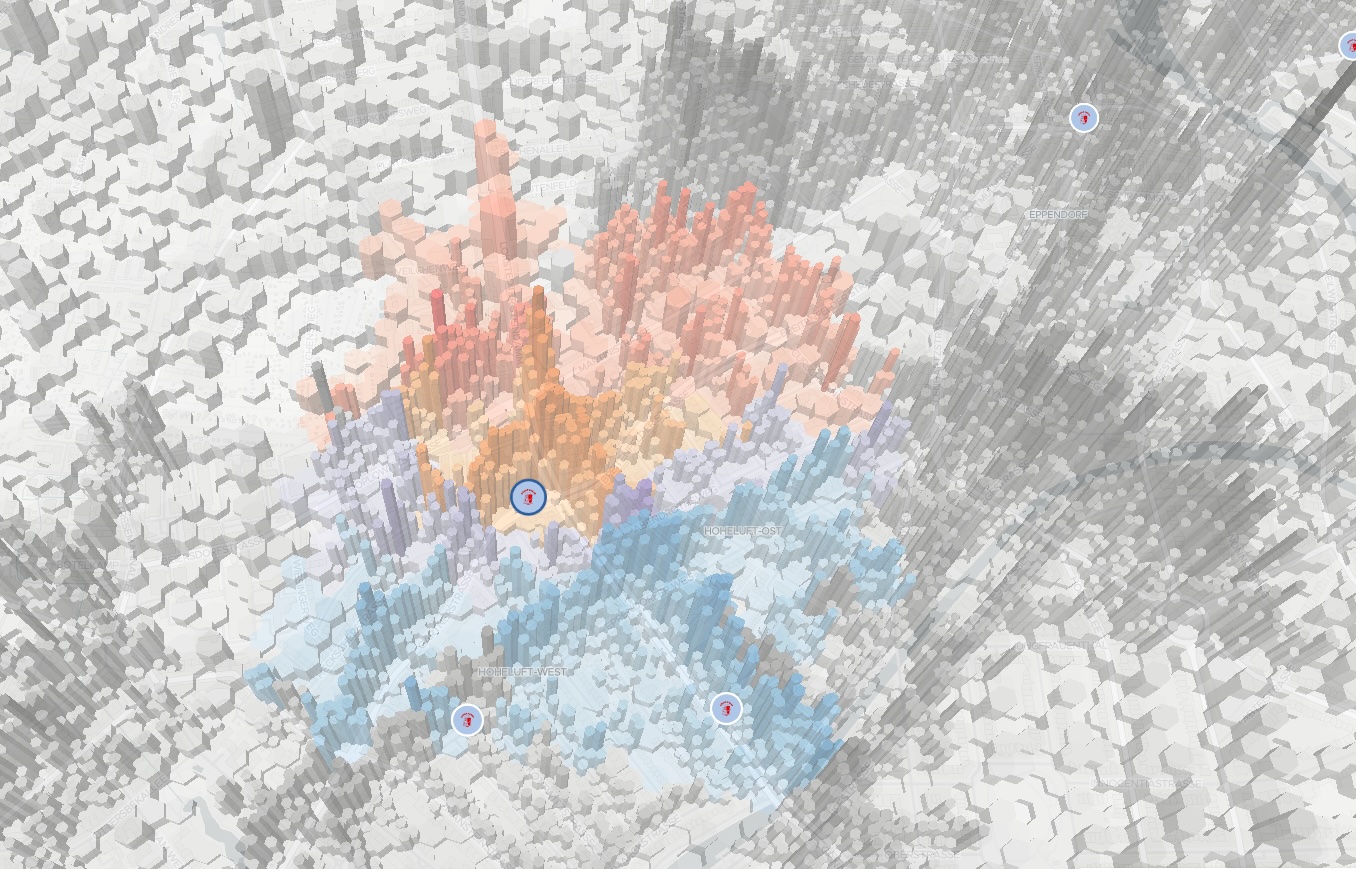
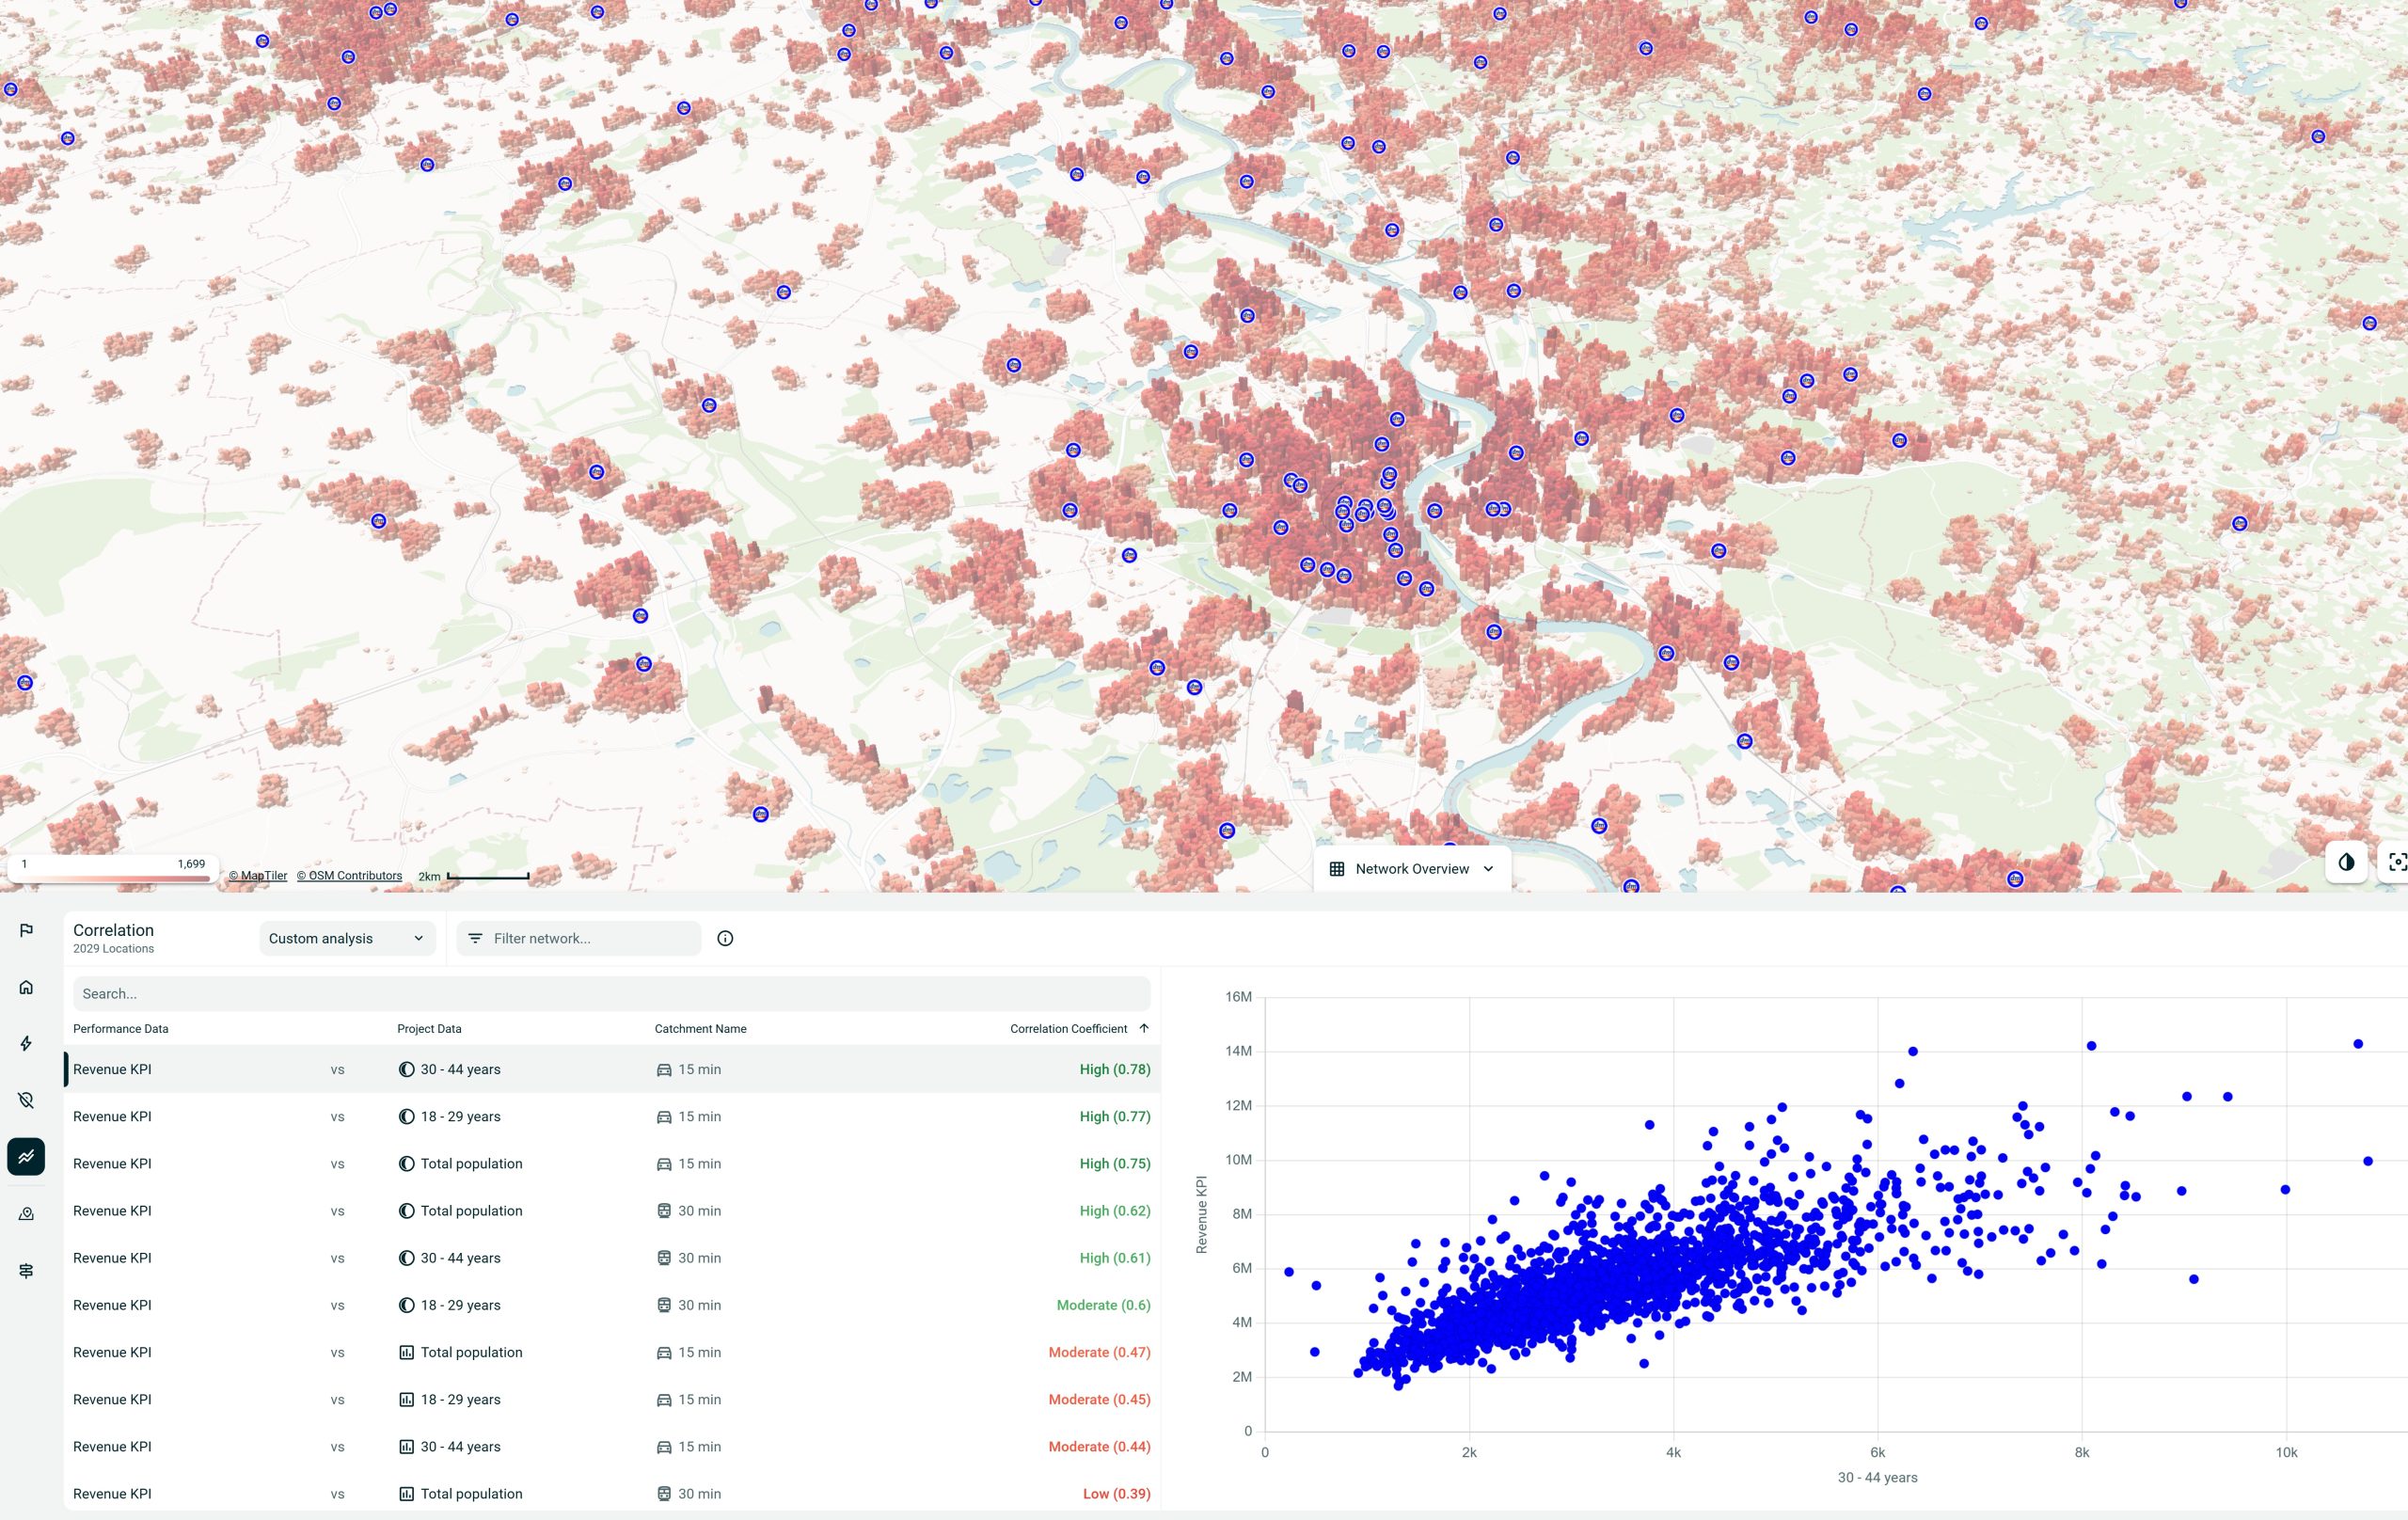
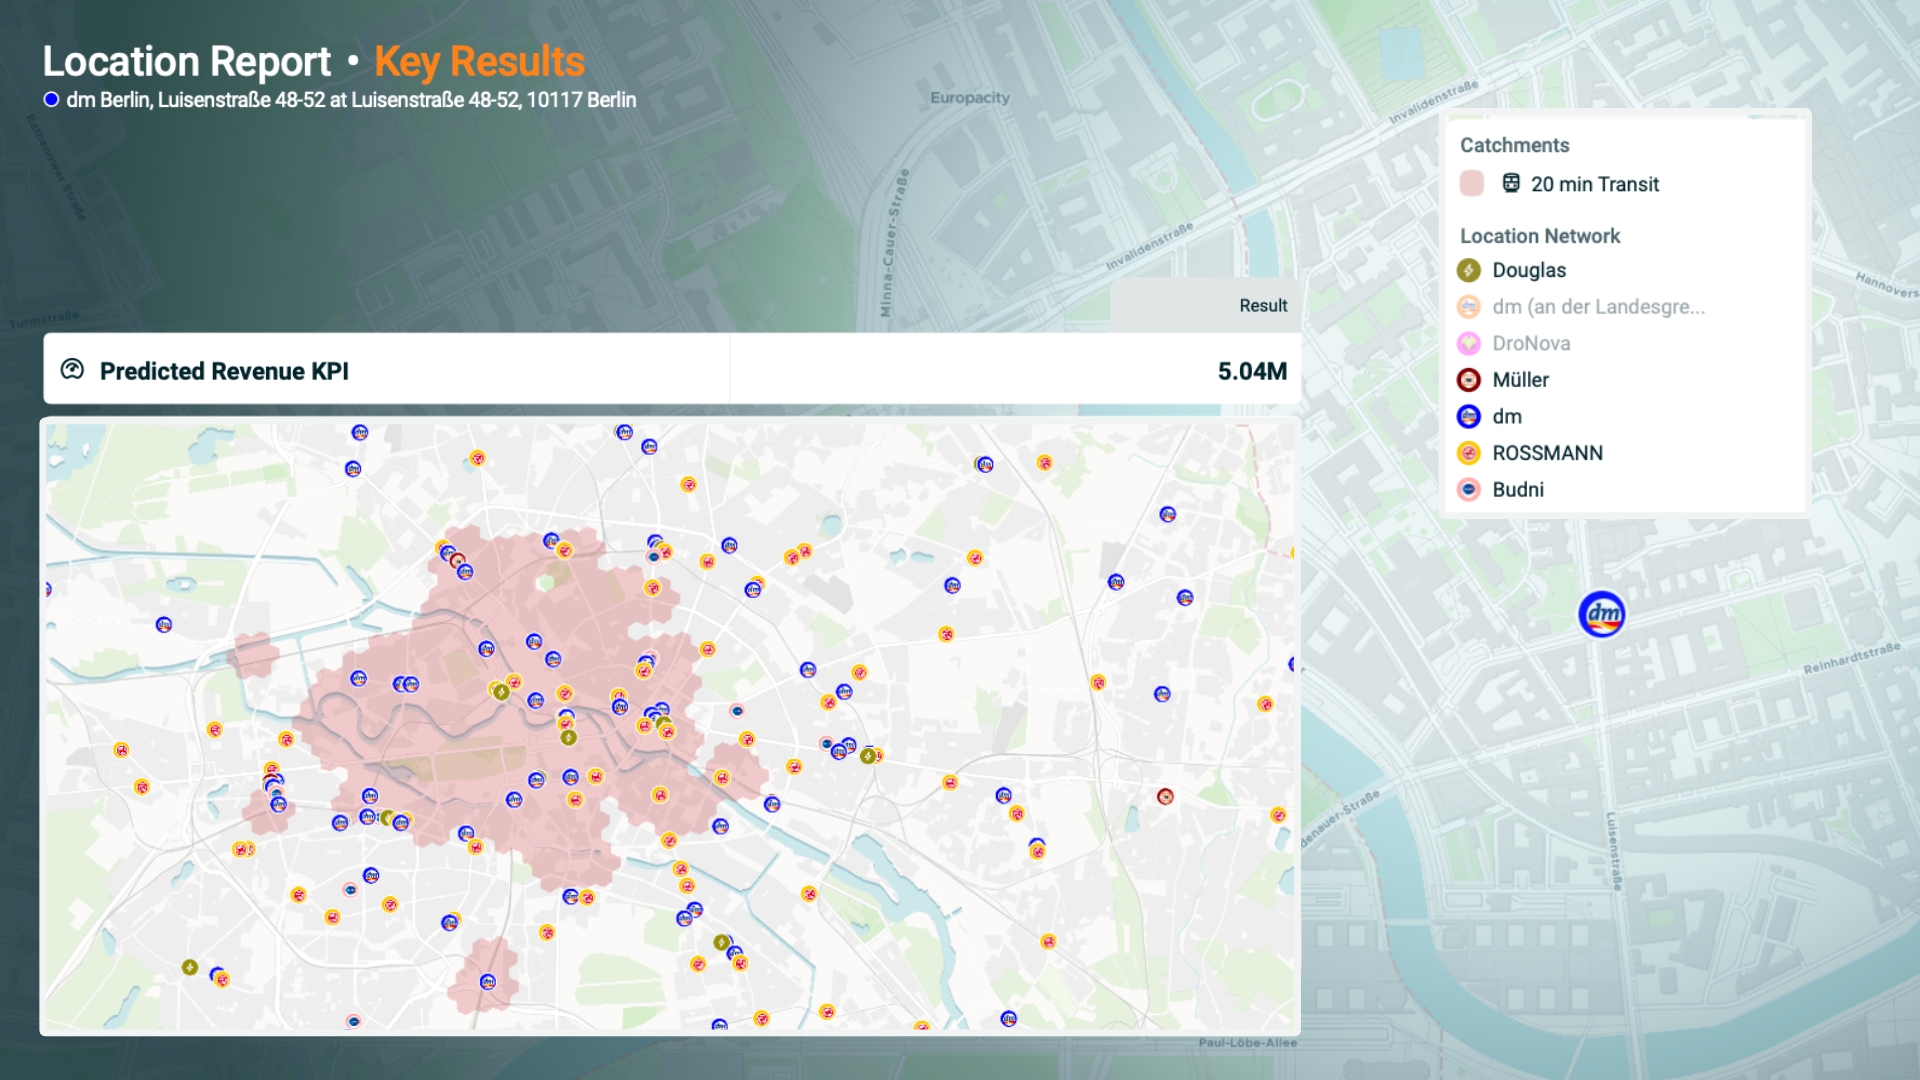
Define and evaluate up to five time- or distance-based catchments per site, connecting data and human mobility.

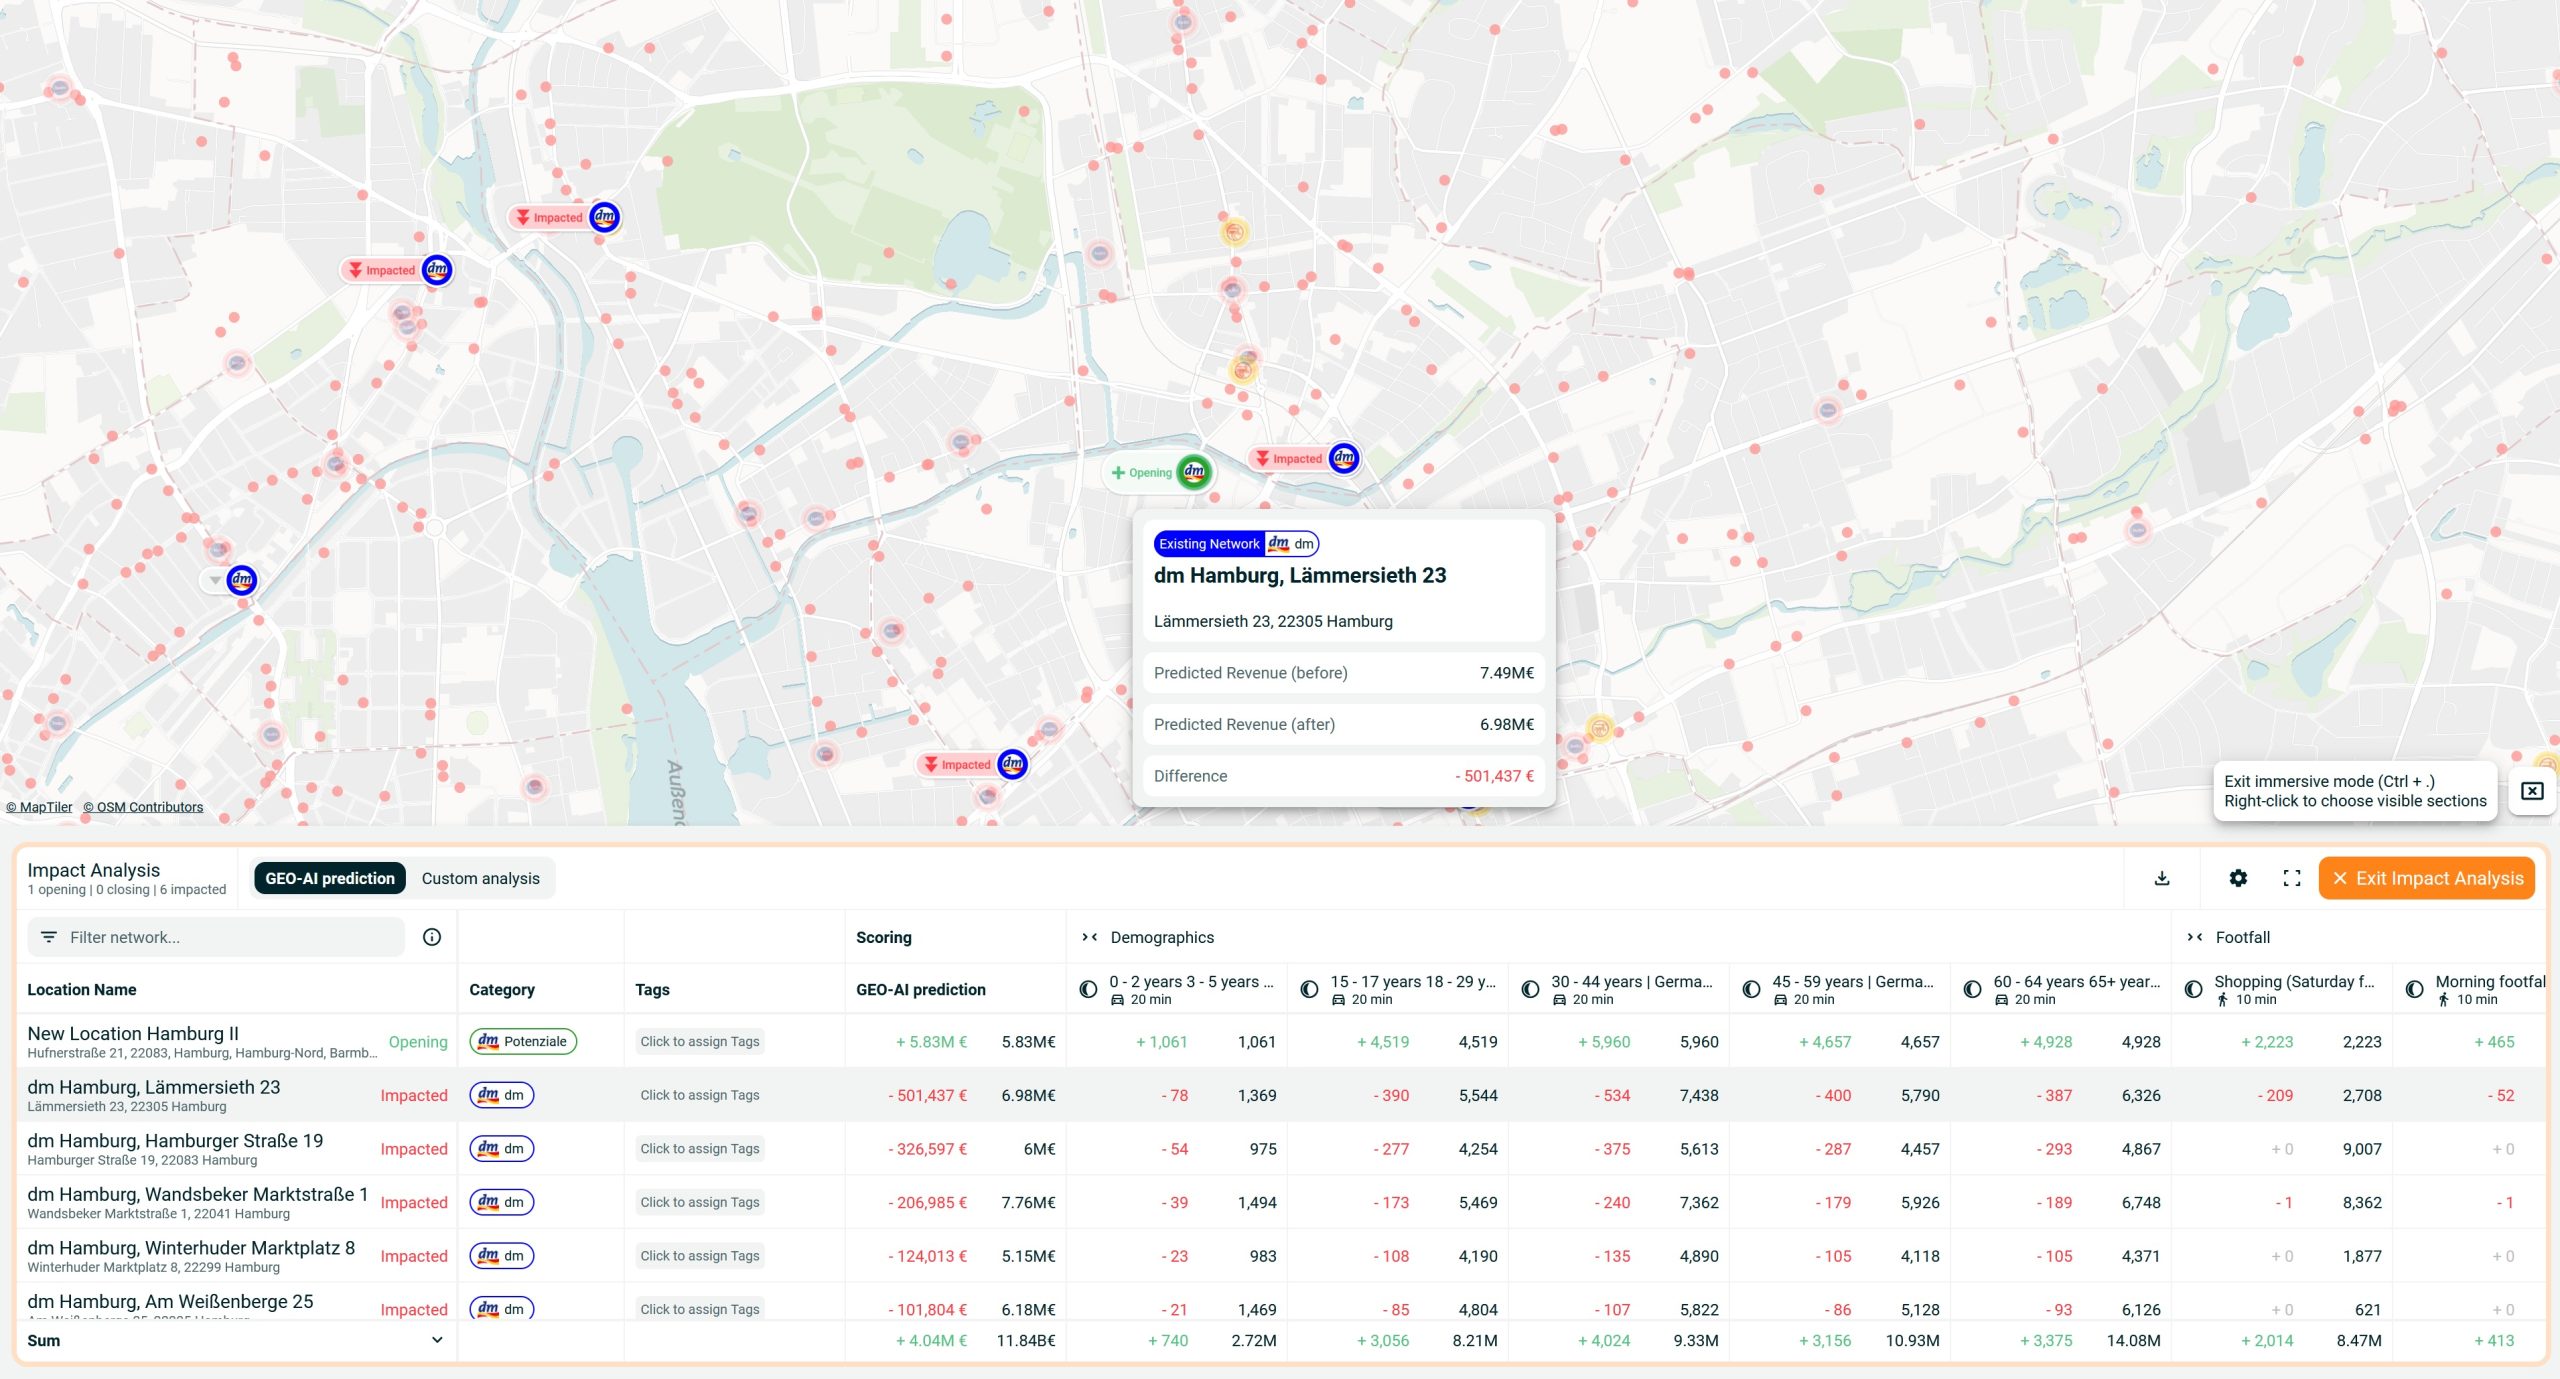
Use advanced modelling to quantify and mitigate internal competition when adding new sites.

Cross-reference your business KPIs with platform data (e.g. footfall) to identify hidden success drivers.

Put your decisions into context to evaluate their impact on your entire network, ensuring informed choices that drive overall growth.


Expand into new markets or strengthen your existing presence with unmatched clarity. TargomoLOOP gives you the insights to make strategic, sustainable decisions for long-term success.
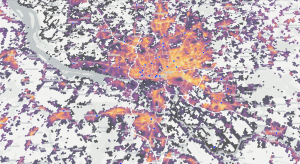
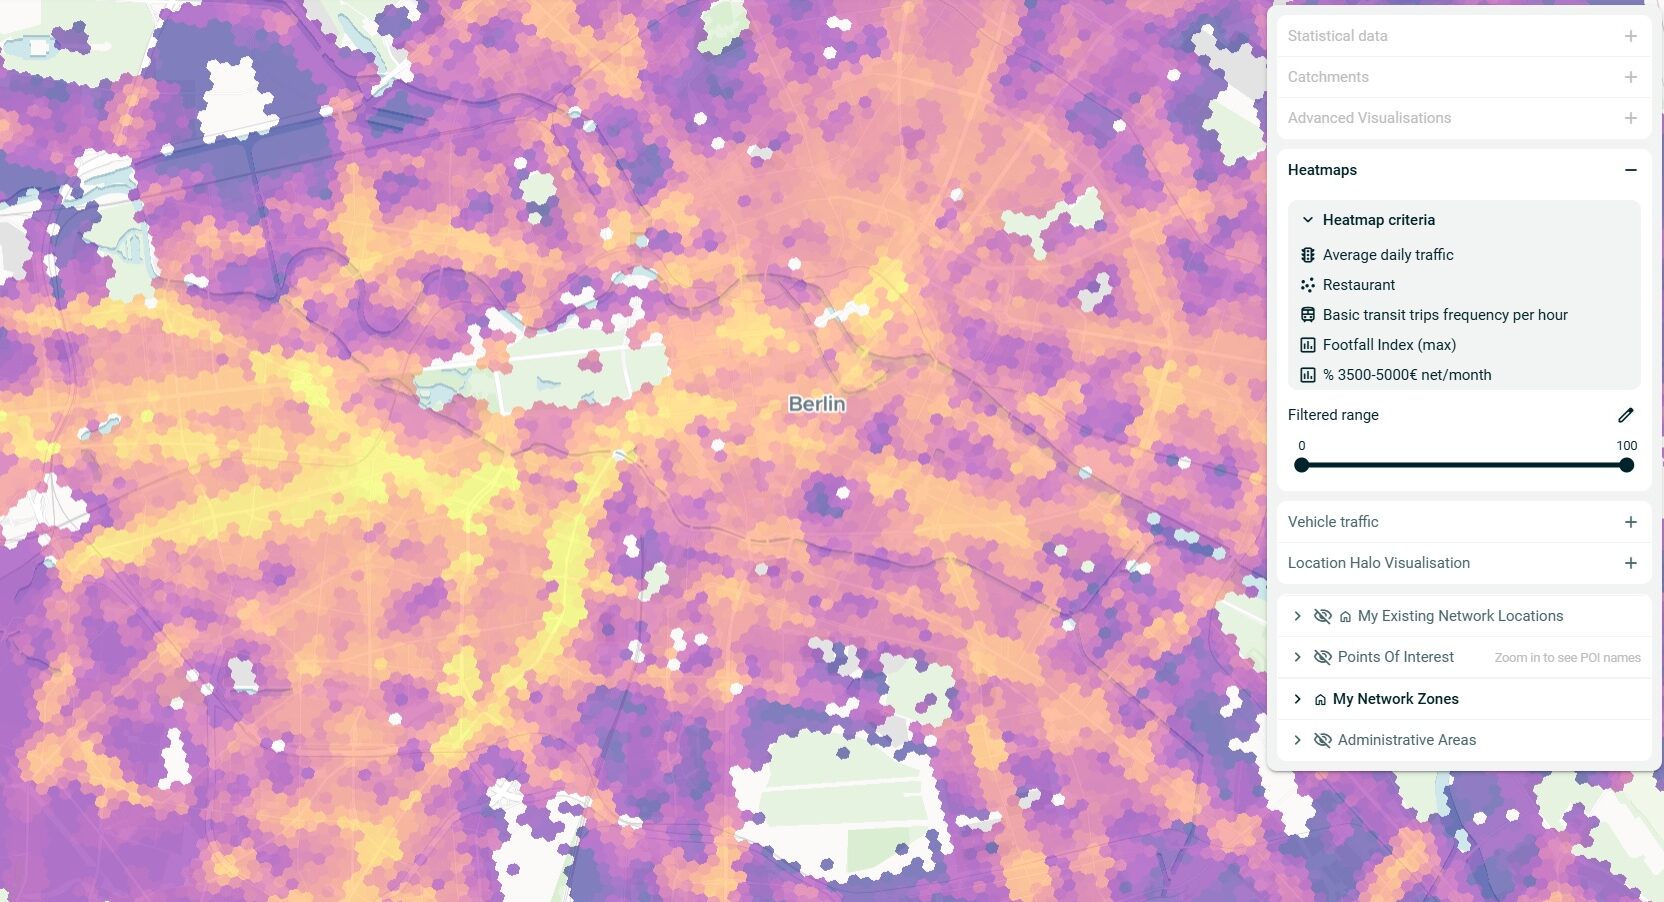
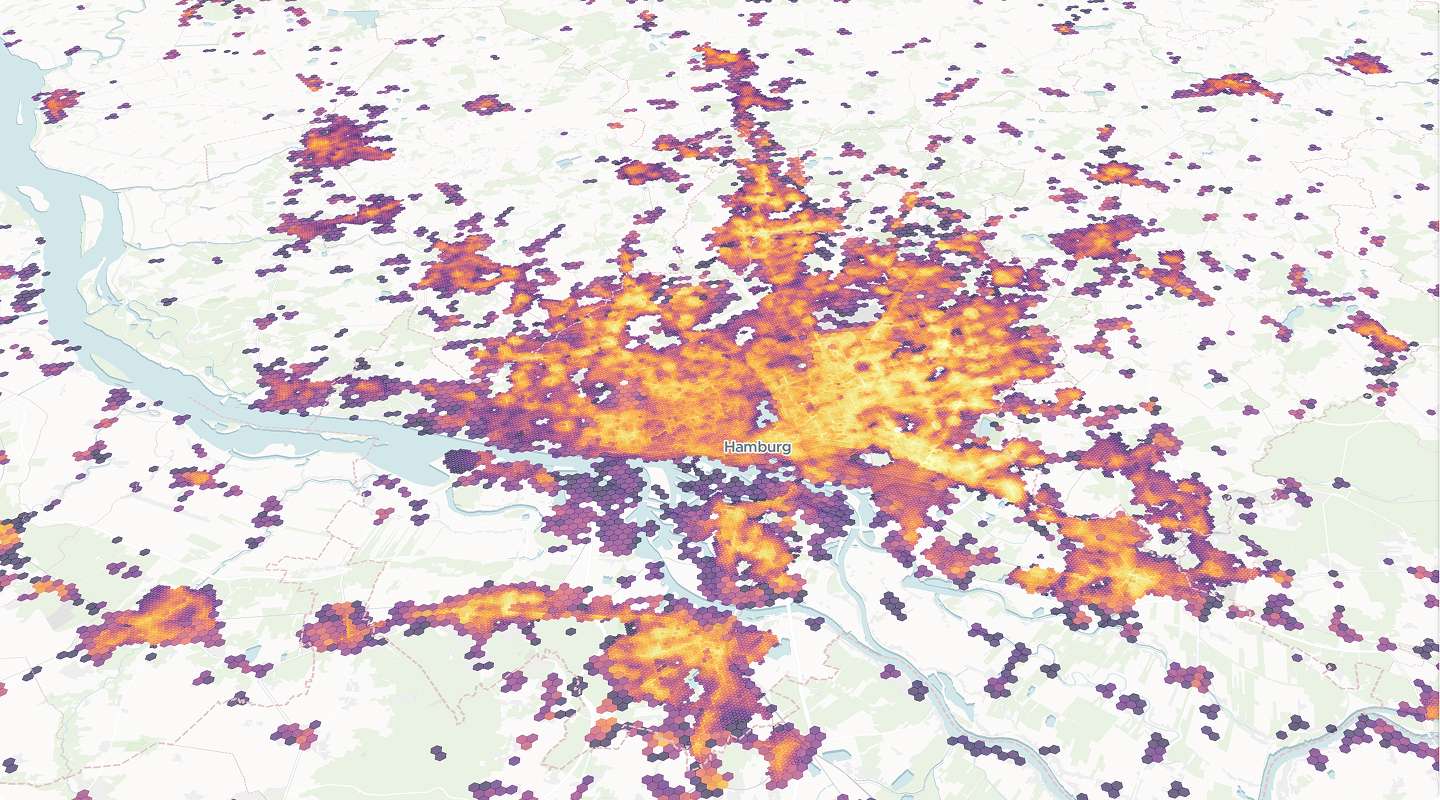
Build dynamic scores and heatmaps using key success factors from your top-performing locations.

Simulate the impact of opening, closing, or replacing sites, and visualise outcomes instantly.

Configure and export detailed reports in PDF format to share insights and support collaborative decision-making.
Analyse, optimise and grow your network across multiple cities and countries within one platform: TargomoLOOP.
Identify high-potential sites and assess existing locations. Leverage traffic data, demographics, footfall, and other high-quality datasets to evaluate performance, uncover new areas, and ensure your business success.
Spot untapped opportunities for your business growth. Plan strategically to outsmart competitors and build a location portfolio that maximises profitability.
Turn your top location into a roadmap for success. Leverage data from your current operations to unlock actionable insights, driving future opportunities with confidence and measurable impact.
“The sound data basis and the intuitive interface were decisive factors in favor of a decision for TargomoLOOP.”


“With the platform TargomoLOOP, we can create rankings and comparisons of potential future locations much faster. With Targomo we get the evaluation at the push of a button.”