Book a demo

Measuring potential visitors by profile – Gravitational model

Feb 17 2023 Published by under Blog

Analyses of individual locations and their catchment areas are crucial for making data-driven location decisions, but they often overlook an important aspect – the impact of neighboring shops and competitors. To address this issue, network analyses can be performed to better understand the interactions and gravitational attraction between shops.

Targomo’s Statistics Context API has some deep functionality, one of which is an implementation of our multigraph API with statistics datasets as the aggregation geometries. This allows us to run complex aggregations – in this case the Huff model. This allows us to calculate the likelihood of certain demographic groups coming to a location and the likelihood of a location attracting the revenue potential of a region.

Interactive demo: Probable branch network visitors

In the example below, we are simulating two store networks: our network (black pins), and the competition: (gray pins). For simplicity’s sake, we are assuming that all locations are equally attractive, aside from distance.

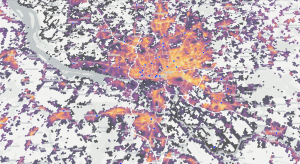
The color of the statistics cells represent how likely the inhabitants at that location are to visit a store in our network. Since the cells contain population data, we can therefore multiply the likelihood by the statistic value to get a total potential visitor count.

How it works:

  • Move the pins to change the location of the shops (dark = own shops).
  • Select the target group
  • Read how many relevant people you are reaching
  • Change the colour scheme for different visualisations

Background: Gravitational model and Huff model

One important outcome of network analyses is the determination of how demand is distributed among existing locations, including both in-network and competition. Gravitational models, which measure the force-based interactions between nodes in a network, are often used to determine this distribution. In the context of retail consumer analytics, the concept of gravity refers to the attractivity of a retail location to potential customers.

By utilizing network analyses and gravitational models, we can gain valuable insights into customer behavior and make informed decisions about location strategies. Understanding the interplay between neighboring shops and the attractivity of each location can help businesses optimize their presence and stay competitive in today’s market.

The Huff model (or Huff’s model), developed by David B. Huff in 1963, builds on the gravitational model. It is a widely used tool for predicting the probability of a visitor to a site as a function of the distance of the site, its relative attractiveness (compared with other sites), and the relative attractiveness of alternatives. In other words, it predicts the likelihood of people preferring one location over another based on factors such as distance, attractiveness and competition.

Comments Off on Measuring potential visitors by profile – Gravitational model

Gustoso Group selects Targomo to dynamically analyse location potential

May 12 2022 Published by under Blog

Analytics platform TargomoLOOP supports the Gustoso group as it expands its fast-growing restaurant concepts

Gustoso Group, one of the fastest growing branded restaurant operators in Germany, is supporting the expansion of business with new location intelligence technology from specialist Targomo. This is helping the company to efficiently identify the best locations for each of its restaurant brands Cotidiano, Ciao Bella, Ruff’s Burger and Otto’s Burger. With the help of the TargomoLOOP platform, the gastronomy specialists are able to quickly analyse the potential of a possible new location to assess whether it is suited to the target audiences of its various brands.

“We were immediately won over by Targomo. The interactive tool allows us to assess potential locations much more quickly and efficiently,” explains Andreas Reitz, Director Development & Expansion of Gustoso Group. Following a successful trial period, the restaurant professionals are now using TargomoLOOP in their day to day work. In addition to efficient data analysis of a location’s potential, based on its competitive situation, demographics, purchasing power and footfall, the platform also enables the structured evaluation of points of interest. These provide information about the area’s characteristics and visitor attractions, which makes it easier to assess the value of footfall for the company’s own business.

Understanding location potential for various restaurant brands

Andreas Reitz’s team uses TargomoLOOP to assess every possible new location and understand its respective potential for the various restaurant brands operated by the group. For example, a location that proves unsuitable for better burger player Ruff’s Burger might well be a good fit for Italian concept Ciao Bella. The varied requirement profiles of the group’s individual restaurant brands, along with key performance metrics from existing locations, have been stored in TargomoLOOP in a way that makes it easy for the gastronomy experts to work interactively with the platform. This allows them to assess the locations’ potential in real time via the user interface without the need to create reports.

Gustoso Targomo screenshot
With TargomoLOOP, Gustoso’s expansion manager get instant insights about the potential of locations for their restaurant brands and possible cannibalization effects.

With Targomo, the Gustoso Group can now drive efficiency into its processes. “Previously, we entered all relevant data into a huge Excel spreadsheet,” reports Stefanie Langhans, Senior Finance Manager at Gustoso Group, “but over time it became so complex that detailed analyses for each potential location became too time-consuming.” With TargomoLOOP, Gustoso Group can now carry out much more detailed analyses and ensure that it only visits properties whose locations are economically viable for one or more of its restaurant brands. “Leveraging the platform, we can minimise existing uncertainties when making location decisions,” Stefanie Langhans is pleased to say.

Replicating success of strongly performing existing restaurants

The fact that TargomoLOOP also allows to very precisely forecast possible cannibalisation effects of potential new locations on existing restaurants is highlighted by the managers of Gustoso Group as a particular advantage. But the gastronomy professionals have even more plans for the platform: In the future, TargomoLOOP will also actively suggest locations that are likely to replicate the success of strongly performing existing restaurants.

The managers of Gustoso Group are quick to praise the cooperation with the Targomo team: “These are smart people who bring great competence to the table. The strong cooperation is very valuable for us,” says Andreas Reitz. For example, joint workshops between the companies highlighted the roles of competition and points of interest, allowing the location search criteria to be optimised. For the Gustoso Group team, Targomo has provided great support in finding the best locations for the 14 new restaurants planned for this year and thus in pursuing its expansion strategy.

About Gustoso Group

The Gustoso Group is an innovative and fast-growing gastronomy company based in Munich. Since its founding in 2015, the group has grown through organic and inorganic growth to around 75 locations across Germany. The group includes the brands Ciao Bella, Cotidiano, Ruff’s Burger and Otto’s Burger. The company’s declared goal is to become one of the leading multi-brand restaurant platforms for the most innovative and successful gastronomic concepts in Europe.


Are you interested to learn more about how Targomo’s technologies help you analyse locations and forecast revenue or guest count? Contact us

Comments Off on Gustoso Group selects Targomo to dynamically analyse location potential

7 mistakes to avoid when choosing a new retail location

Feb 04 2022 Published by under Blog


Choosing to open a new retail location is an exciting prospect, whether it’s your first store or the next in a chain.

The old adage “by failing to prepare, you are preparing to fail” has never been more apt than when choosing your next retail location. With so many factors to consider, as well as the pandemic creating shifts in how people shop, and a host of other trends to take into consideration, doing your research is vital.

Start your research journey here, with the help of this list of mistakes to avoid when choosing a new retail location.

1. Not considering retail cannibalisation

While it makes great economic sense to expand your bricks-and-mortar business into multiple locations, it’s important you watch out for ‘retail cannibalisation’.

In the first quarter of 2018, Starbucks – the popular coffee chain with a store on every corner – was suffering from market saturation. With so many stores available, and a burgeoning competitor market, its stock plummeted 11.38% at a time when the overall market was up 4.1%. As a result, it started shutting stores in the United States.

Of course, healthy competition is great for any business, but in the retail industry, cannibalisation occurs when branches of the same chain that are near each other end up competing with one another for the same business.

The same is also true of competitor businesses. If too many similar businesses are located in the same catchment area, customer loyalty and preference is going to favour one business over another. An oversupply of locations also leads to higher operational costs, as Starbucks found to its chagrin.

Screenshot TargomoLOOP - Cannibalization
It is possible to expand your budding empire while avoiding cannibalisation. Using tech solutions such as TargomoLOOP, you can get a more accurate picture of catchment areas and potential overlap.

So before you decide for a location, check how your branches influence each other. A good technology solution lets users immediately see whether the new store would “steal” potential customers from existing shops in the same area and how many. They can also see how many customers they could potentially win from competing shops nearby, and how a competitor’s new location might impact the catchment area of their retail stores.

2. Not knowing your competitors

In 1920, American mathematician Harold Hotelling came up with a theory called Hotelling’s Model of Spatial Competition. His model shows that when competing for locations, every business wants the “central point” as it is the most strategic spot to be as close to as many customers as possible. But because every business has ultimately the same intention, stores become clustered around the same location and end up competing with one another.

Putting that theory into practice, Marc Smookler, a United States retail expert, conducted a study in Austin Texas in 2015. He concluded that CVS and Walgreens pharmacies were, on average, only 1.5kms apart, and Walmart and HEB (a grocery chain) were 1km apart.

So sometimes you’re drawn to an area because that’s where the market is. But you should also know who your competitors are, what they specialise in, what their USPs are and how your business is similar or different. And most of all: where they are located. Because this gives you the chance to identify “whitespots” with the highest market potential.  

3. Not taking complementary shops into account

We’re all familiar with the concept of the strip mall (in Germany they’re also known as Fachmarktzentren): an out-of-town shopping area characterised by a centralised parking area and a parade of shops or big box stores clustered together. Over time, and even during the pandemic, these areas have out-performed city centre locations.

According to JPMorgan, “The pandemic had a major impact on retailers in city centres heavily reliant on office workers and tourism. But service-oriented strip mall retailers in densely populated urban and suburban neighbourhoods performed well throughout 2020 and 2021. These properties have consistently performed well regardless of market conditions.”

This successful recipe stems from considering other nearby businesses not as potential competitors, but as opportunities to draw the right target market to the location.

Complementary businesses offer products that relate to or complement yours:  a pharmacy near a doctor’s office, a bar near a restaurant near a hotel, a sports shop near a gym, a pet supply store near a veterinarian, a cafe next to a bakery.

We recently interviewed a retail expansion manager who said “for my client who rents out deposit boxes to store people’s valuables, I analyzed how many banks are located around a potential new site”.

So if you are looking for the ideal location for your business, you should also analyse which other shops in the area complement your offer and are beneficial to your business.

4. Overlooking how people travel to your store

Understanding how people travel to your store is vital. Are you in the middle of a city where parking is at a premium? Are you out of town and far away from public transport? Do customers have to pay to park near your store? Do you sell large, bulky items that require a car?

It’s important not to overestimate how many people will travel to your store by car, and consequently underestimate how many will use public transport or other forms of mobility.

A recent study in Berlin, Germany, discovered that retailers often make the mistake of overestimating the amount of people who travel by car when they go shopping.

The report, which surveyed 145 traders about how they thought customers got to their shops, and interviewed 2,019 shoppers on two shopping streets in Berlin, discovered that shop owners overestimated how far customers travel to visit their businesses.

“Over half (51.2%) of shoppers lived less than 1 kilometre from the shopping street. In contrast, traders on average estimated that only 12.6% of customers live within this distance.” The results appear to show a big discrepancy between the perception of traders about customers’ mobility patterns and the actual reality.

Furthermore, the study appeared to show that traders often misjudged how customers travelled to their shops, underestimating public transport and overestimating car use.

“While only 6.6% of shoppers travelled to the streets by car, on average traders estimated 21.6% of their customers use this mode; a discrepancy of 15%,” says the report. “Further they underestimate transit, pedestrian, and bicycle travel by 8.1%, 6.2% and 3% respectively.”

Before deciding on a location, analyse it for accessibility, considering different modes of transportation such as walking, biking, driving, and public transportation.

5. Misjudging foot traffic

Foot traffic is one of the hallmarks of retail. At its most basic, it means the number of people walking past. It’s one of the key metrics for retailers, as the pedestrian activity near a shop influences sales volumes and increases the chance of spontaneous buying or “impulse purchases”.

So if you’re deciding on a location for your new business and benefit from spontaneous purchases or visits, you should take a closer look at this figure. But be careful: often a general figure is not enough. You should also consider whether there are fluctuations throughout the day and how foot traffic behaves on weekends compared to weekdays.

Furthermore, you should also check what causes the traffic. Are vehicle data included, or are only pedestrians counted? Just because a location has high frequency doesn’t mean that people have the time for a spontaneous visit to your store. Therefore, Foot Traffic should only count visitors who spend at least a certain amount of time in the area, not just passing through.

6. Overlooking demographics

But while foot traffic is important, it’s not the only consideration. During the pandemic lockdowns, foot traffic in some areas went down significantly as people preferred to shop close to their homes because of travel restrictions. Suddenly, hyper-local shopping became popular.

Because of this, it’s crucial to understand the demographics nearby, what the average household size is and how many children live there children, for instance. If you really understand the catchment area, you’ll discover how many potential customers can reach your location. This can give you a good understanding of whether the site is attractive or not and whether it will appeal to your target customers.

7. Not locating your target group

As a business owner, you probably have a fair understanding of who your target customer is. But defining who they are and locating them is not so easy. What problem is your business trying to solve for them? What is the benefit of your product? Do you serve a particular niche market, and do you have enough potential customers in your catchment area? What other companies nearby offer the same or a similar product or service as you? According to Marketing Donut, “successful marketing relies on understanding your target market. Who are you selling to? Why should they buy your product? What do they stand to gain?”

In a blog on WordStream, the writer Dan Shewan, said: “If you run a small business, maybe you have an idea of your target market. However, a vague idea is not enough to compete in today’s ruthless business environment. Without detailed knowledge of your target market, you could be losing business to your competitors or missing out on opportunities to increase sales.”

Ultimately, the right location is the place where your target customer visits or lives. With powerful location intelligence, you can unlock the door to compelling insights that could be the difference between business success or failure. With TargomoLOOP, you can analyse data such as population age groups, household size, spending power and lots more to help you understand how you can find and reach your target group.

Comments Off on 7 mistakes to avoid when choosing a new retail location

We use cookies on our website. They provide us with web analytics, helping to give you the best possible experience on all pages. To learn more and see a full list of cookies we use, visit our Privacy Policy

Essential Cookies
Google Analytics
HotJar
We use cookies on our website. They provide us with web analytics, helping to give you the best possible experience on all pages. To learn more and see a full list of cookies we use, visit our Privacy Policy.
These cookies help us understand how you use the website — which pages are most visited, how long users stay, and how they navigate. All data is anonymous. Enabling these helps us improve the site.
These cookies track clicks, scrolling, and how you interact with content. They allow us to analyze usage through heatmaps and session recordings. You can disable these if you prefer not to share this type of data.