Book a demo

Location Intelligence Optimizes Oslo’s Public Transit Network
Mar 03 2020 Published by under Blog

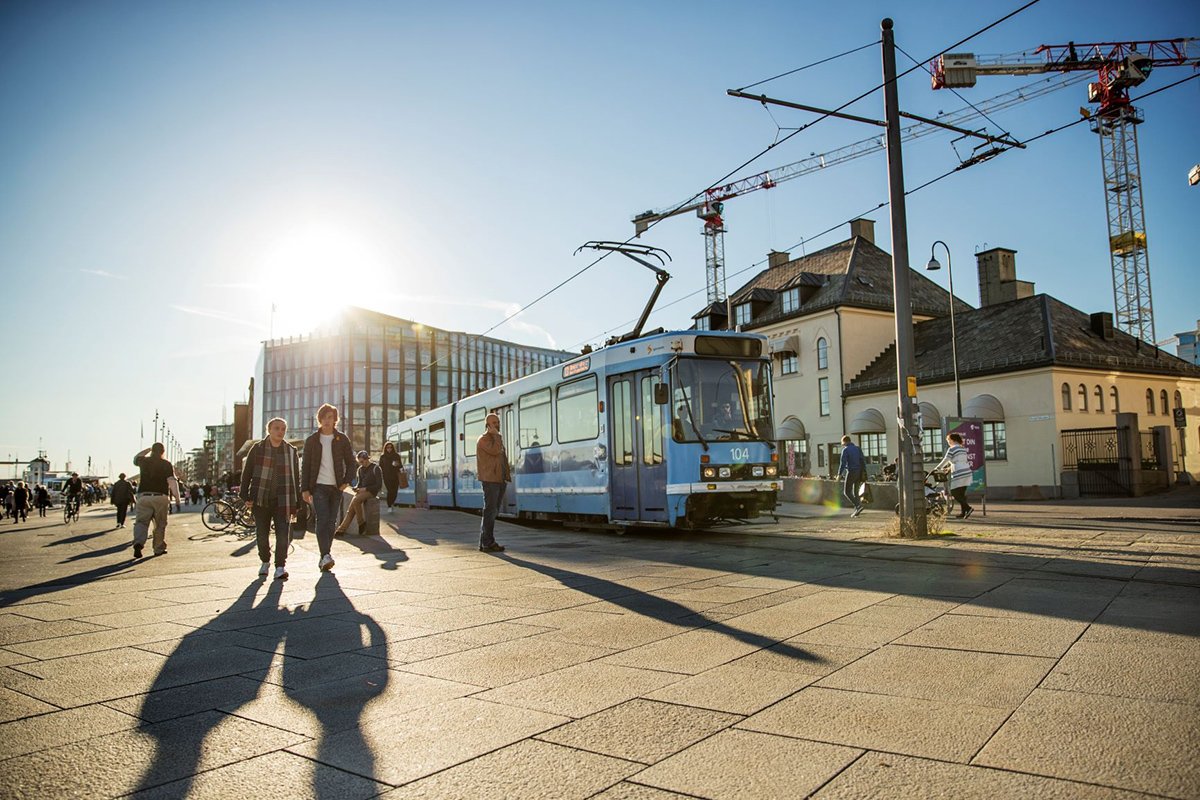
Oslo’s public transport authority Ruter uses location intelligence to easily analyze the impact of network changes and to win support from politicians and commuters. With TargomoLOOP, Ruter can quickly see how its network should evolve to serve more people, more efficiently. Picture source: Redink Thomas Haugersveen / Ruter

Picture source: Redink Thomas Haugersveen / Ruter

Oslo’s public transport authority Ruter uses location intelligence to easily analyze the impact of network changes and to win support from politicians and commuters. With TargomoLOOP, Ruter can quickly see how its network should evolve to serve more people, more efficiently.

Transit Authorities Face Many Challenges

As in many big cities, the public transport authority in Norway’s capital has to respond to demographic developments, changes in the usage of transportation means, and constructions projects. In the Oslo metropolitan area, home to more than 1 million people, rerouting lines has a large impact: Ruter’s contractors handle more than 380 million journeys per year and operate around 250 metro, tram, bus and ferry lines.

The municipality-owned company turned to Targomo in 2015 to analyze the impact of new bus stops or redirected routes and determine the optimal number of stops on a line. Later, they also used the platform to find the best location for a new electric mobility hub, examine whether citizens can easily access newly developed areas, and define the potential market when changes or expansions are planned.

[quote text=”This platform helps us to provide the best transit system possible, and that is something the whole community and our customers will gain from.” type=”long” name=”Trude Flatheim” role=”Strategic Traffic Planner at Ruter#”]

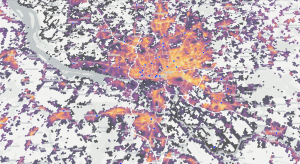
Ruter combines its own network and passenger load data with census figures in Targomo’s platform, which calculates the travel time to the nearest transit point from any place in the city. At an aggregated level, it shows how many people can reach a transit stop or any stop of a line within ten minutes on foot, for instance.

With these sophisticated, yet easy-to-use calculations, Ruter can quickly forecast the impact of network changes, analyze different scenarios, or examine the effects of a completely new line.

“It is much easier to see how many people are affected,” said Trude Flatheim, a strategic traffic planner with Ruter. “This platform is simpler than what we used to have. Everyone can go in there and make these analyses in a couple of minutes instead of hours.” Even people who are not skilled in using geographic information systems (GIS) can quickly get started. Flatheim and her colleagues can use the application every time when a network change is discussed and even show the analysis live to stakeholders.
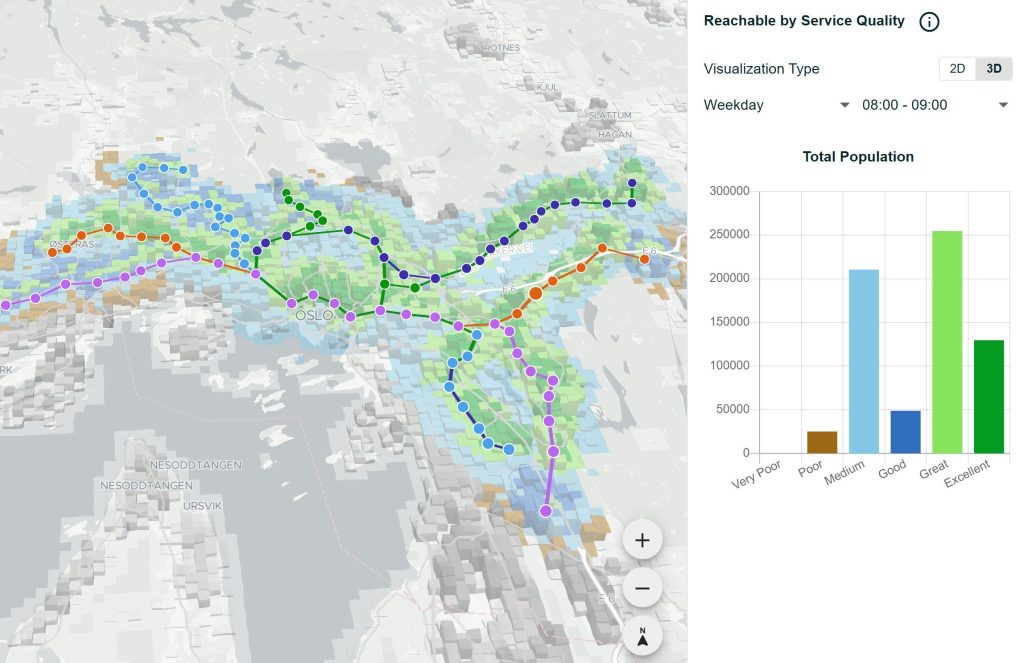
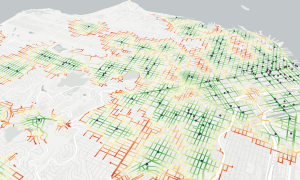
Oslo’s public transport authority Ruter uses location intelligence platform TargomoLOOP to easily analyze the impact of network changes and to win support from politicians and commuters. Picture source: Targomo / RuterThe blue and green shaded areas show which customers have decent access to Ruter’s five metro lines based on frequency and the stops’ reachability. Graphic source: Targomo / Ruter

Maps and Numbers Build Stronger Arguments

The platform helps Ruter to win support from commuters and politicians in the municipalities of the Greater Oslo Region to make network changes, whether temporary or permanently. In fact, people can better understand the results of the analysis because they’re visualized on a map.

For example, Ruter has used the results to explain to commuters why certain network changes made sense, even when these meant longer travel times for some travelers. “We have to make people see the whole picture; it all comes down to this cost-benefit analysis,” Flatheim said. “We have to do that all the time. It’s easier to show them when we have the maps and tools.”

The Mobility Needs of a City Are Rapidly Changing

Transit authorities need to analyze the potential of areas where new development, such as a new hospital, is planned. How many people could use the new location? How will they get there? Ruter is now able to plan and decide whether to offer more services in new areas even before construction has started.

Mobility behavior and policies also change, requiring novel initiatives. Together with the Norwegian Public Roads Administration and the City Environment Agency in Oslo, Ruter has used Targomo’s platform to find a suitable location for a new mobility hub, where people can pick up and share electric vehicles, bikes and scooters. The site is closely located to several bus stops. “It is a way how we think about arranging mobility in the future, offering new modes to move around in the city,” Flatheim said. The hub, part of an initiative to make Oslo a carbon-neutral city, was taken into operation in August 2019.

By incorporating new data sets in Targomo’s platform, Ruter’s forecasts become even more reliable and up to date. The transportation authority is currently testing mobile phone usage figures to make dynamic predictions based on citizens’ movements in the city throughout the day and week. These figures could accurately forecast when and where the need for buses, trams, trains or ferries would be biggest.

Targomo supports Ruter in offering a customer-centric network and responding adequately and timely to new modes of transportation as well as policy changes. Managing a highly complex network has become simpler.


Make data-based decisions fast, easily convince your stakeholders, and learn how Targomo could improve your public transportation network.

Comments Off on Location Intelligence Optimizes Oslo’s Public Transit Network

How Open Data Can Make Cities Smarter – And What Is Holding Them Back

Oct 29 2019 Published by under Blog

When visiting this year’s Smart Country Convention in Berlin, one gets the impression that cities and municipalities globally are more or less on the verge of becoming “smart”. But is that truly the case? We found some lighthouse examples and one of the biggest obstacles on the way to a smart future.

As we support the public sector, we participated in the Smart Country Convention Berlin last week. This forum for the exchange of strategic advice provided the opportunity to learn more from experts about the current state of affairs. While most cities are facing unique situations on a granular level, many places struggle with similar challenges. This year’s partnering country – and role model – was Lithuania. For them, becoming smart was the most pragmatic choice: “We’re not big, we’re not rich, so we have to be smarter”, their Foreign Minister Linas Antanas Linkevičius explained.

The impressive Baltic state has been so successful in fact, that its capital city Vilnius is overwhelmed by the incoming UK tech companies looking for new places to run their business. The city’s recipe for success consists of both top-down and bottom-up approaches. By creating the optimal legal frameworks and infrastructure conditions, the government paves the way for young companies to thrive with new business models.

Vilnius: The Impact of a Radical Open Data Policy

Some of these companies are working towards new transport solutions, with good reason: “Regardless of size, all cities have mobility issues”, the mayor of Vilnius, Remigijus Šimašius said on stage. Once citizens establish routines, adjustments are difficult because of inherent resistance to changing habits (individual car ownership for example).

The mayor of Vilnius, Remigijus Šimašius, is presenting the city’s innovation approach at Smart Country Convention Berlin: “The mobility experience starts with leaving the house”.

The mayor reminded us that the main beneficiaries of mobility are neither the municipalities nor the service providers, but the people. Mobility should not be an end in itself. Instead, mobility solutions should focus on the benefits they bring to their users.

The starting point of innovations should be micro-decisions of citizens as opposed to some overarching goal. But how to tackle all these challenges? One way, Vilnius decided, was a radical open data policy. Vilnius claims to be one of the first in Europe to create a public city data platform that provides open-source data for all businesses and citizens – “without excuses”.  As a consequence, since September 2017 it’s the home of Trafi, one of the most advanced mobility apps in the world. Trafi bundles all public mobility solutions, making it easy to navigate the city without a private car. This is not a one-way success story tough. Trafi provides the city administration with so much new data that it’s fundamentally changing traffic planning.

Other cities are also impressed: Recently, Trafi and the BVG (Berlin’s transit agency) launched Jelbi, to bring the same mobility experience to the citizens of the German capital.

Low Quality and Bad Coverage May Render Open Data Unusable

But if igniting the spark is so easy, why are many city governments struggling to follow that open data approach? In our daily work with open data sources from all over the world, we encounter a wide range of problems. Two of the most significant ones: Coverage and quality.

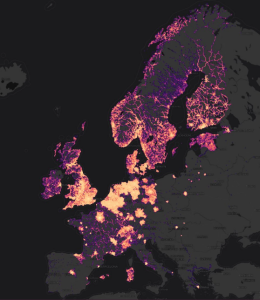
We’ve created a map that shows all open data on public transportation throughout Europe. The differences are significant, even within individual countries.

For many of our customers, precise travel time analysis with public transport is key for answering their mobility questions. Integrating public transport data for Germany alone means using data sets from more than 80 federal transport authorities, many of which have to be contacted personally and may be reluctant to share their data. Consequently, it’s almost impossible to create a complete picture of Germany’s public transport landscape at this moment.

On the other hand, good intentions on their own aren’t enough, the correct execution is equally important. Large-scale data sets need homogeneous structures. Lina Bruns, a research assistant at Fraunhofer FOKUS, demonstrated at the Smart Country Convention how minor syntactical inconsistencies in data descriptions – such as putting a phone number as either 040/9595 or 040-9595 – can cause considerable additional effort, while incomplete data sets can quickly render all available information unusable for the majority of analytical purposes.

Bruns argued that agencies lack strategy, processes, tools, or resources to make sure their data solutions fulfill the necessary quality requirements. To help them, FOKUS released new guidelines this week for the improvement of data and meta-data quality, focusing especially on the necessary setup and structure of data.

While this is certainly a great help for those who already have an open data strategy, we hope that events like the Smart Country Convention convince more government agencies that they need one in the first place.

Comments Off on How Open Data Can Make Cities Smarter – And What Is Holding Them Back

We use cookies on our website. They provide us with web analytics, helping to give you the best possible experience on all pages. To learn more and see a full list of cookies we use, visit our Privacy Policy

Essential Cookies
Google Analytics
HotJar
We use cookies on our website. They provide us with web analytics, helping to give you the best possible experience on all pages. To learn more and see a full list of cookies we use, visit our Privacy Policy.
These cookies help us understand how you use the website — which pages are most visited, how long users stay, and how they navigate. All data is anonymous. Enabling these helps us improve the site.
These cookies track clicks, scrolling, and how you interact with content. They allow us to analyze usage through heatmaps and session recordings. You can disable these if you prefer not to share this type of data.