


Catchment area analysis is a critical starting point for site selection, expansion planning, and network optimisation. When done properly, it shows more than simply the reach of a certain location. This article covers how to run a structured catchment analysis step by step: from choosing the right transport logic and building multiple catchment layers, to selecting the right data for each use case and applying it across retail, restaurants, and fitness industries.
What Is a Catchment Area?
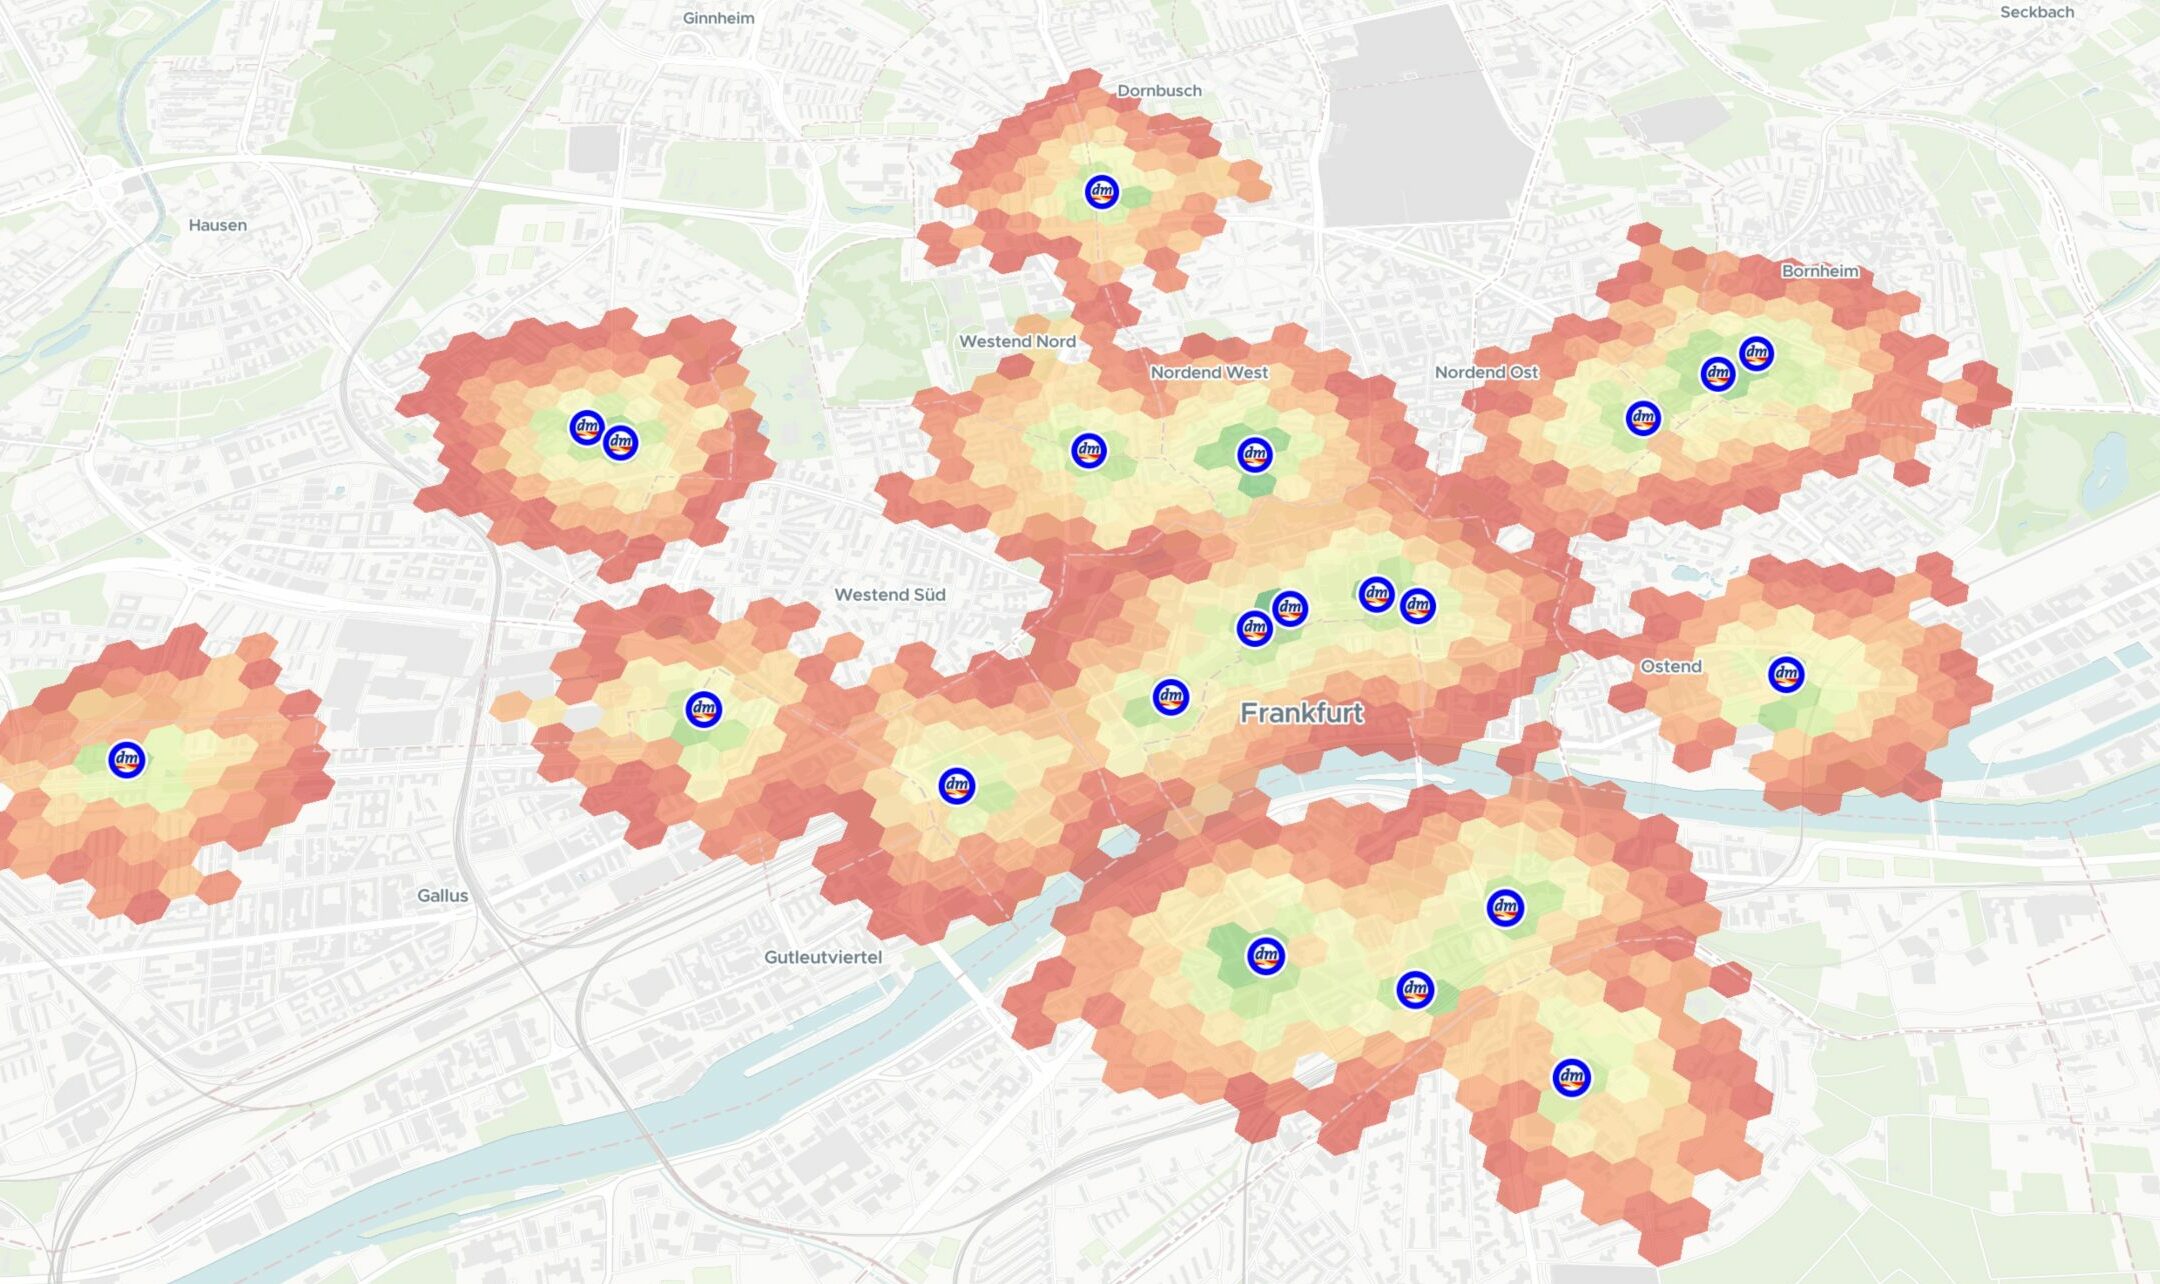
A catchment area is the geographic zone from which a location can potentially draw visitors. It is a measure of reach and accessibility across different travel times, distances, and transport modes. In practice, catchments show how many people live, work, or move within a reachable area, and what type of demand exists within it. Thus, a well-structured catchment area analysis answers:
- Who can realistically reach the site, and by which transport mode?
- What kinds of demand exist nearby: residential, workforce, tourism, passing traffic?
- Is the location better suited to impulse visits, planned visits, or both?
How to Run a Structured Catchment Area Analysis
A proper catchment analysis goes beyond showing how many people can reach a location. At Targomo, we approach catchment analysis as a structured process: start with the business context, choose the right transport logic, build multiple catchment layers based on it, and analyse each one against the type of demand that matters most for the specific business concept.
1. Start with Analysing the Business Model
A catchment analysis starts by identifying which type of visit matters most for the specific business. Some formats rely heavily on visibility and spontaneous decisions. Others depend on planned, recurring trips. Some need a strong pedestrian flow close to the site. Others need a broad local population base, easy parking, or strong public transport access.
Understanding this difference helps determine which catchment layers, transport logic, and data are most relevant for the analysis.
2. Choose the Right Means of Transportation
Catchments change depending on how people move through an area. At Targomo, we analyse accessibility using different transport options:
- Short-distance radius (typically 50–500 metres)
- Walking (typically 5–10 minutes)
- Cycling (typically 5–20 minutes)
- Public transit(typically 15–45 minutes)
- Car (typically 15–45 minutes)
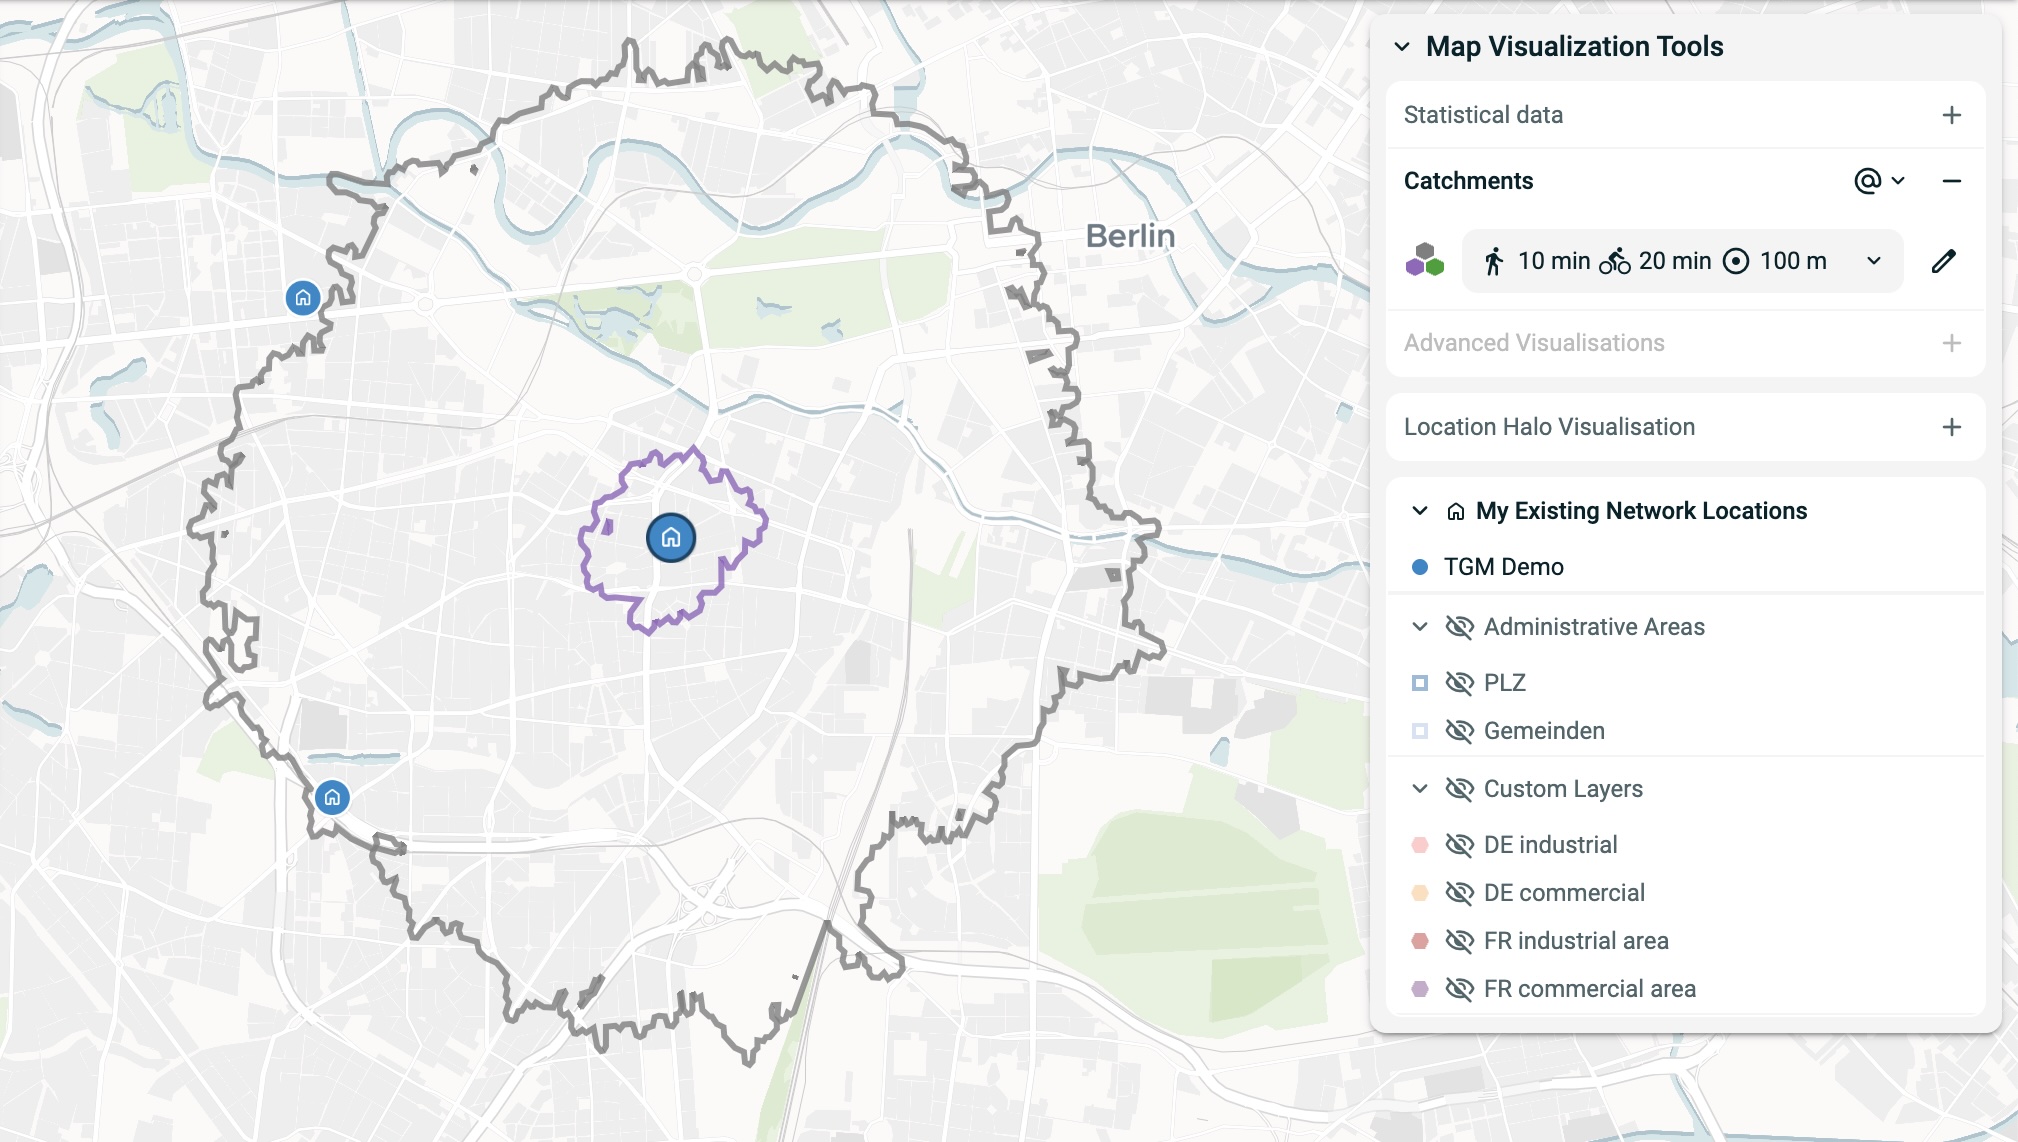
Explore this demo to see how catchment area changes across different routing and travel options.
Each of these travel options shows a different aspect of reach. Radius and walking catchments help explain immediate local accessibility. Public transport is often essential in dense urban areas. Cycling can also be highly relevant in cities, where it often reflects everyday access better than driving. Car-based catchments remain critical for many destination-driven businesses, and across the countryside. Thus, we model realistic travel times that account for traffic and rush-hour effects. Depending on the use case, the optimal travel times or distances for a catchment are defined.
3. Build Multiple Catchment Layers
At Targomo, we define three catchment layers. For a thorough analysis, we recommend evaluating several layers at once, as each one captures a different dimension of reach and demand.
Micro Catchment: Immediate Surroundings
This is the zone directly around the site, typically within 50 to 100 metres. It captures what is happening at very short range: people passing directly in front of the location, immediate visitor activity, and nearby complementary businesses.
Most relevant for: high-street retail, F&B, and other businesses where visibility and impulse drive a significant share of visits. The more impulse visitors the site needs to attract, the more important this layer becomes.
Local Catchment: Neighbourhood Level
This catchment typically covers around 250 to 500 metres, or a 10-minute walk from the analysed location. This is often the layer where impulse-driven and planned demand begin to overlap. It focuses on the people who spend a significant amount of time in the area: locals, office workers, students, or other regular visitors in the area.
Most relevant for: convenience-driven businesses serving nearby residents, as well as concepts that depend on regular local demand from residents, visitors, or the surrounding workforce.
Macro Catchment: Regional Reach
This layer usually focuses on reach by car or public transport, and less often by cycling, within a 15–45-minute travel time. It captures where customers are likely to come from for planned visits. It is typically defined using travel-time-based areas (isochrones) across different transport modes.
Most relevant for: destination retail, fitness, grocery, hospitality, and other business concepts where customers are willing to make a deliberate trip.
These layers do different jobs: the micro catchment explains immediate capture potential, the local catchment explains the surrounding context, and the macro catchment defines the broader reachable market.
4. Define What Data to Use for Each Catchment Layer
A catchment only becomes useful when matched with the right data. Using footfall data for regional reach, or socio-demographic data to evaluate micro catchments can lead to misleading conclusions. To get meaningful results, each catchment layer should be matched with the data that best explains it.
Data for the micro catchment
The micro catchment is about immediate exposure and impulse-driven purchase. Relevant data often includes:
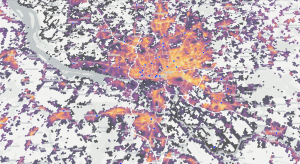
- Footfall and footfall index (split by time of the day, day of the week, month)
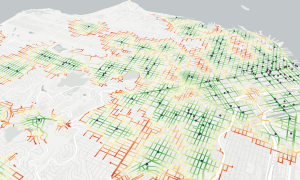
- Car traffic (split by time of the day, day of the week, month, distance from home, trip length)
Data for the local catchment
The local catchment explains the surrounding context that shapes everyday demand and is most relevant where impulse-driven and planned visits begin to overlap. Recommended data to include:
- Visitor presence and visiting patterns (split by time of day, day of week, and month)
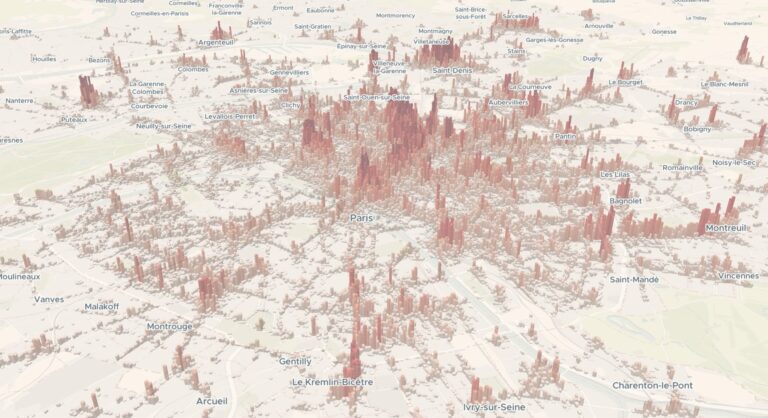
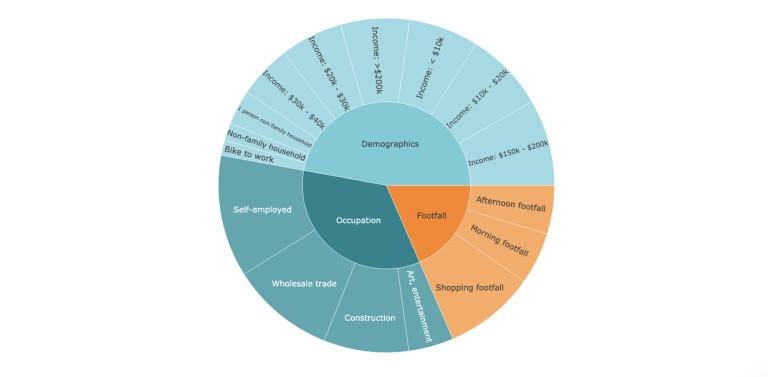
- Local population and socio-demographics (age, income, and household characteristics)
- Points of interest (POIs) (complementary and competitive)
- Public transport stops (number of trips, trip frequency, trip type)
- Car traffic (split by time of day, day of week, month, distance from home, and trip length)
- Parking data (trip length and distance from home)
Data for the macro catchment
The macro catchment helps quantify the broader reachable market for planned-visit businesses. Relevant data often includes:
- Local population and socio-demographics (age, income, and household characteristics)
- Tourism data (tourist accommodation, overnight stays)
- Competitor POIs
Not all datasets should be used everywhere. Selecting the right data for the layer is essential to truly explain potential demand.
5. Enhance Catchment Area Analysis with Gravity Models
Catchments show who can reach a location. They do not show who is likely to visit it. Customers choose between alternatives, and those choices are shaped by distance, convenience, visibility, attractiveness, and the surrounding offerings.
At Targomo, we take catchments one step further with gravity model analysis. Instead of only defining who can reach a site, we estimate how likely people from each cell in the catchment area are to choose one location over existing and potential network sites or competitor sites. That creates a more realistic view of capturable demand than classical catchment area analysis alone.
The logic of the gravity model forms the basis of Targomo’s GeoAI approach which helps predict the performance, including revenue predictions, of existing or new locations.
Why Teams Choose Targomo for Catchment Area Analysis
At Targomo, we help businesses move from simple reach to a more realistic view of a site’s potential. With TargomoLOOP platform, users can combine catchment layers, data, and competitive context in one place making site evaluation more consistent and decision-ready.
In practice, this means:
- Understanding which catchment layers matter most for your business with correlation analysis
- Comparing existing and potential sites and their impact on the network with benchmarks
- Identifying the site’s overlap and cannibalisation early in the process
- Accessing all relevant data within one platform
- Building a consistent process for network planning across various markets and formats.
How Catchment Area Analysis Applies Across Industries
The basic method of running catchment area analysis stays consistent, but the importance of each layer changes by sector. Different industries depend on different combinations of micro, local, and macro catchments.
Retail
Catchment analysis in retail varies from impulse-driven to destination-driven formats. High-street retail usually relies more on the micro catchment, where visibility, footfall, and car traffic shape demand. Larger formats depend more on the macro catchment, where local population and their socio-demographics, tourism data and competition define trade area potential.
Restaurants
Restaurants’ demand is usually a hybrid of impulse and planned behaviour that shifts throughout the day. Often, the site’s performance is determined by the interaction of micro, local, and macro catchment layers over time. Micro catchments capture visibility and spontaneous visits. Local catchments explain the daytime economy: offices, transit, and retail clusters. Macro catchments underpin destination and repeatable demand. Time-of-day analysis is critical here: a site strong at lunch can be weak at dinner, which needs to be accounted for during the analysis.
Fitness & Health
For gyms and fitness studios, where demand is driven by planned, recurring visits, local population fit and competitive density matter far more than visibility. That is why socio-demographic data (such as age, income, and household characteristics), as well as competitive POIs, are usually more important than footfall. In this case, local and macro catchments are typically the most important layers to analyse.
From Catchments to Better Expansion Decisions
Catchment area analysis is one of the fundamental concepts of a good location planning strategy. When done well, it becomes a powerful tool to evaluate where demand can come from and how to maximise the performance of a certain location.
A comprehensive catchment analysis starts with assessing the business context. The task is to understand which catchment layers matter most, what data fits each of them, and where simple reach needs to be complemented by competition and gravitation. By combining layered catchment analysis with the right data and business context, Targomo helps various industry leaders to make better location decisions.
Ready to evaluate your next expansion opportunity with multi-layer catchment analysis?
You May Also Be Interested in