


See the Big Picture with POIs Fast
Points of interest — from supermarkets to cinemas, from schools to transit stops — greatly shape the character of a neighbourhood, a city or even a country. Being able to easily examine their patterns can deliver valuable insights into people’s movements, local preferences, as well as urban planning.
This is why POIs are an integral part of Targomo’s location intelligence projects: They allow retail and real estate managers, city planners, journalists and tourists to immediately understand that area in terms of commercial appeal, public service level or cultural life.
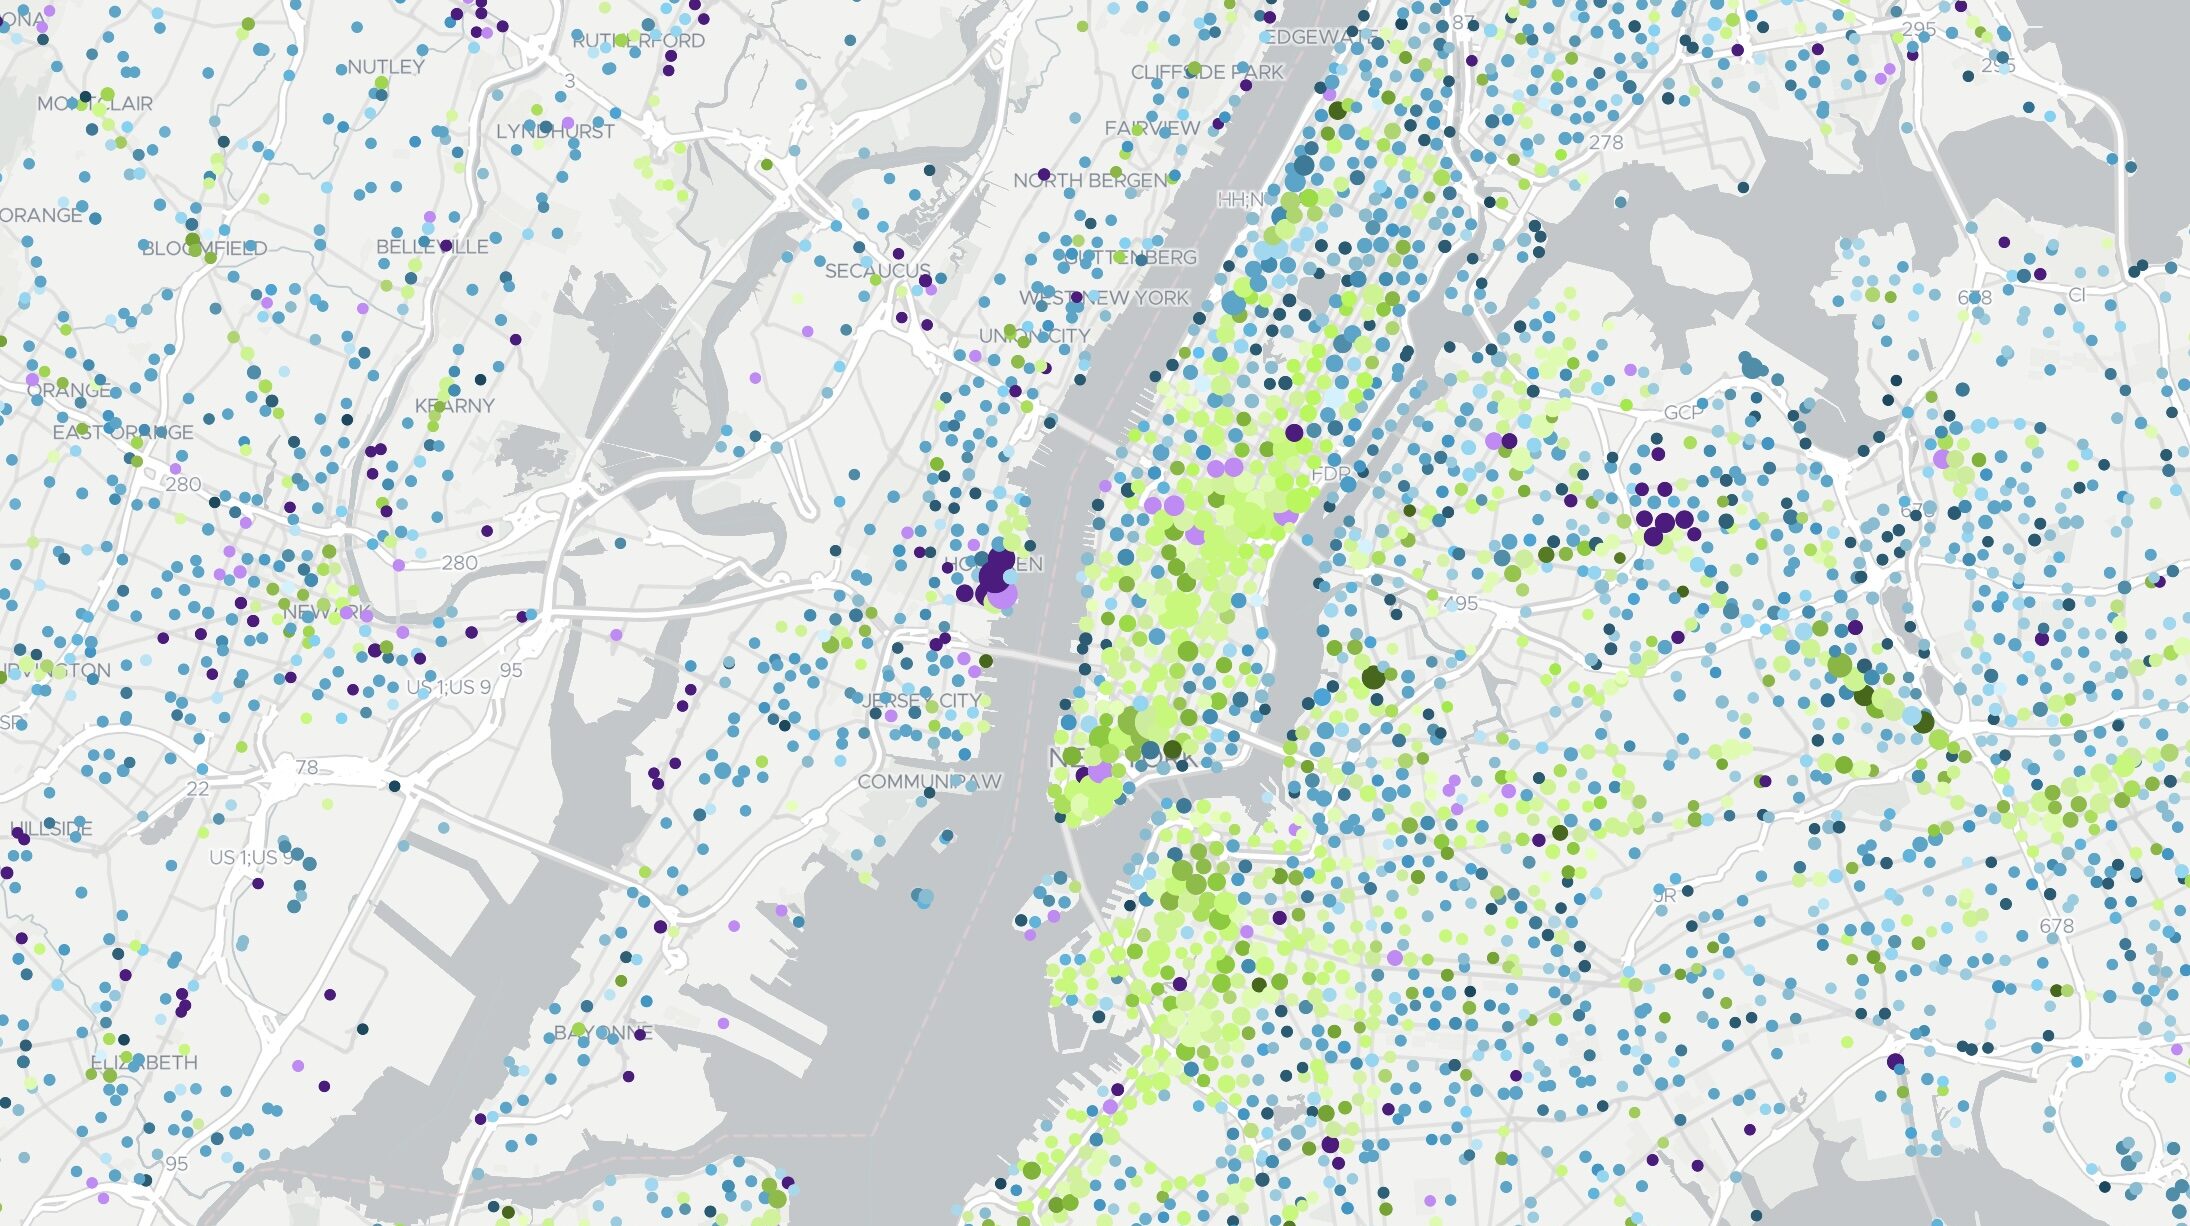
Targomo developed the tool to quickly display thousands of POIs of distinct categories on an easy-to-use map. It provides access to more than 30 million data points gathered by the global OpenStreetMap community.
Precise Insights at Every Level
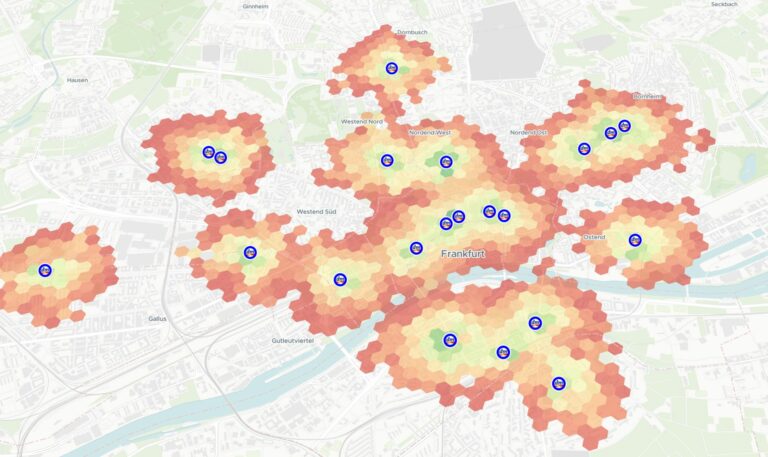
In dealing with so many data points, the main challenge is to render information at every zoom level. Cluttering the map with thousands of data points would otherwise make it difficult to draw conclusions. With Targomo POI, the visualisation remains informative both at street level and from a national perspective. “We can easily show what makes neighbourhoods, regions or even countries unique,” said Henning Hollburg, founder and managing director of Targomo. “With a single map, it is clear where a city’s shopping hotspots are or where ice skating is popular. This is highly valuable information for property managers, businesses, advertisers, or consumers moving to a new city.”
Embed POIs into Your Website
Targomo POI is available as a ready-to-use website, which builds shareable maps instantly. Do you want to visualise all childcare facilities in London within your blog article? Or assess the distribution of competitors for your business network in an unknown market?
Simply embed the map, including your selected POIs, by copying the URL and adding it as an iframe to your website. The freely available data, which OpenStreetMap contributors collect, is continuously expanding and updated every minute.
Add POI Power to Your Own Map App
The technological basis of the tool is the TargomoAPI, which is free of charge at the entry level. If you are a developer, you can use Targomo’s APIs to easily include the POI data in your online maps. Furthermore, you can use it in combination with other services, such as Targomo’s travel time analyses. With this, for example, you can filter POIs by travel time. Your map searches will be much more interactive, and you can enhance your applications with location intelligence.
Visit the POI app and check points of interest in your area or visit the API documentation if you’re a developer.
Map data © OpenStreetMap contributors