

Case Study: Sales Forecasting with Geo AI
Geo AI to support retail location planning
When expanding a business, especially opening a new store in a new region, the biggest questions to be answered is whether the store can be expected to perform well and how much revenue it could potentially generate. Revenue prediction is very important in supporting site selection and decision making for ensuring a successful expansion, and there are several approaches that aim to deliver accurate forecasts.
Two machine learning algorithms that are commonly used to predict revenue are Random Forest and XGBoost. In this revenue prediction case study we compare the results from both these popular models with the results generated by Targomo’s Geo AI model. Geo AI is a location-based model, aiming for a better understanding and evaluation of the characteristics of the shop location.
The basis for this case study is the publicly available data for liquor sales data in the US-state Iowa. For the prediction, we selected the brand Hy-Vee and treated liquor sales of other brands as competitor data.
Who is Hy-Vee? Hy-Vee is an employee-owned chain of supermarkets, mostly located in the Midwestern and Southern US. Its headquarters is in West Des Moines, Iowa. Hy-Vee has over 285 locations in 8 states in the US, including among others Iowa, Illinois, Missouri. As all data of liquor sales in Iowa, Hy-Vee’s data was publicly available.
Three Methods compared: Random Forest, XGBoost, and Geo AI
The three models Random Forest, XGBoost, and Targomo’s Geo AI were used for the revenue prediction. The Random Forest and XGBoost models are often applied in prediction as their advantage is their efficiency in dealing with high dimensional data. In addition, both random forest and XGBoost are decision-tree-based models and easy to work with – there’s no need to normalize data and Python/R packages are readily available to use. It can create a relative robust model even with outliers and missing values. The drawbacks, however, are also obvious: Potential over fitting issues and low interpretability.
Geo AI is a locational-based method. The foundations of the model were developed as part of a research project conducted by Targomo in collaboration with the Hasso-Plattner-Institut and funded by the Deutsches Zentrum für Luft- und Raumfahrt.
Geo AI, gravitational model and attraction strength
One major component of Geo AI is a gravitational model. It follows the idea of Newton’s law of gravitation applying the concept to market models. According to Newton’s law of gravitation, high masses (attractiveness in market models) and short distance lead to strong attraction. The attractiveness is measured by the store’s characteristics and environment. These factors could be characteristics like store size, parking space, product range, or location factors like complementary shops, competitors or other points of interest close by.
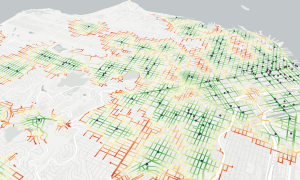
In our model, these factors are called attraction strength. The distance, in Geo AI, is calculated based on travel time with catchment areas defined by travel time and travel mode including car, bike, public transit, and walking. A travel-time-based catchment area provides a more accurate and realistic assessment of population than more naïve distance-based catchments.
CASE STUDY ‘Geo AI for retail sales forecasting’ – Summary
Step 1: Data collection
To begin, Targomo’s data team first needed to compile data from various sources to calculate the general demand and attractiveness of stores:
- Publicly available data on liquor purchases: The data covers shops with Iowa Class “E” licences, such as grocery shops, liquor shops and convenience stores. The dataset records store-level liquor purchases from 2012 to present and includes the store name, store id, store address and coordinates, date of order, the item ordered, category of the item, and sales dollar. The sales dollar is calculated by multiplying number of bottles and the state retail price, and this is what is predicted in the case study.
- Sociodemographic data: Age group, income, occupation, family structure, methods of transportation to work, and more.
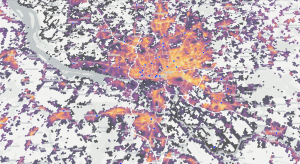
- Mobility data: Movement data in terms of foot traffic indicates how many people are at a location over a certain period of time.
- Store attractiveness data: If customers perceive stores within a catchment area to be differently attractive, this can impact which store they choose for shopping. To account for attractiveness in the prediction model, we included direct customer feedback in the way of Google reviews. We considered the average Google ratings and the number of ratings. In addition, the opening hours (viewed over a year as the number of hours) were also considered.
- Competitor Data: As the publicly available data covered all liquor sales, stores other than Hy-Vee are considered as its competitors.
- Which data was missing? Store size and sales area sizes usually has a significant influence on the revenue of a store and should always be part of the prediction. In this case, the data was not available and could not have been taken into account.
Step 2: Data cleaning – The foundation to build a meaningful model
Data cleaning is one of the first and most important steps in modelling as cleaned data is the foundation of a correct model and its output. The process of data cleaning involves detecting inaccurate, incomplete, and duplicated records, and then fixing or removing them.
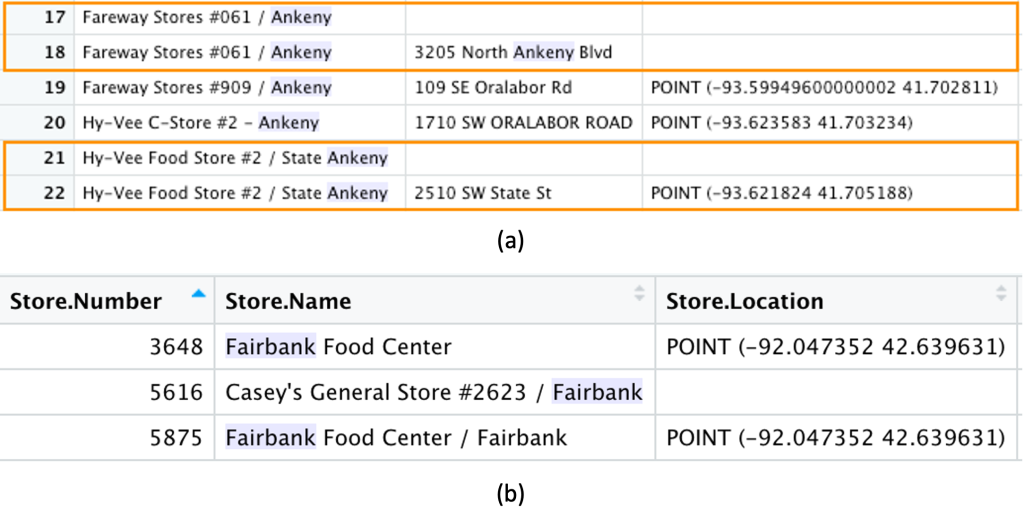
- Inaccurate, incomplete, and duplicated records detection: Many records in the data lacked addresses and coordinates (Figure a, highlighted in orange boxes), so the data science team added the missing data with known entries or from geocoding results. Additionally, it happened that the same stores appeared twice with a different store id (Figure b, Store.Number 3648 and 5875). To identify these duplicates, Targomo’s data science team calculated a distance matrix between all shops. If the distance between two shops was less than 50m, a cluster was formed. Then all the shops in the cluster were manually checked in Google to identify whether they are the same shop or not. If the shops were the same, ‘Store.Number’ was updated to be the same as well.
- Outlier identification and handling missing value: After the inaccurate records were corrected, sales dollar per month in 2019 were summed up for each store, the number of unique liquor categories and liquor item bought were also counted. If a store did not report sales data for each month, it was removed from the training data set. However, it was used in the analysis like a competitor – meaning a store that potentially attracts customers, but whose sales are not known.
Furthermore, stores with extreme high or low annual sales have also been carefully reviewed, noting that some were beverage and liquor retailers. Since these stores cater to different customer groups – namely other stores – these outliers were removed from the data set. Casinos, hotels, inns, and distilleries were also removed.
Step 3: Train the Predictive Model with Data
In countless iterations, the Geo AI engine is fed with data to continuously learn which data composition represents Hy-Vee’s store performance.
The training consists of two main components:
- Key Driver Analysis: We detect the attraction strength factors. These are the location variables that make a location attractive for for the target group and draw customers to the site. In a continuous testing and learning process, the model is built.
- Validating & Fine Tuning: In countless iterations, we validate the model against additional store data and fine-tune the prediction model.
Training error vs. Testing error
There are two relevant values measured during the learning process that indicate the prediction quality: The training error and the testing error.
- The training error measures the ability of a given model to accurately predict the results of the same data on which the model is trained. This helps us further train and tweak the model in the direction we want.
- The testing error is measured using predictions for a data-set, or several sets, the model has not seen before. This can help us see how well the model performs outside the training environment and is useful in preventing issues such as over-fitting.
When it comes to prediction results, the testing error can be considered to be more meaningful because it gives us an idea of how well the model will perform on new, unseen data – like the address of a potential new location for a shop opening. A low training error is a precondition for, but alone not a sufficient indicator of a successful project.
In our revenue prediction projects we usually go through two phases during the model training:
- In the first phase we want to get the training error down to prove that the model is expressive/complex enough to make predictions for the specific use case and that we have all required input. Low training error is a pre-condition but not sufficient alone for a successful project.
- In the second phase we want to generalise the model, so that it works for new, unknown locations. So we want to bring the testing error down, often by reducing the model complexity again.
Results: These are the location variables driving liquor sales
The table compares the model accuracy and detected success drivers of three liquor sales prediction models for Hy-Vee stores. The training error of Geo AI model is 16% and the testing error is 19.8%, while the testing errors of Random Forest model and XGBoost model are 38.1% and 30% respectively. Compared with the two commonly used models, Geo AI yields the highest model accuracy.
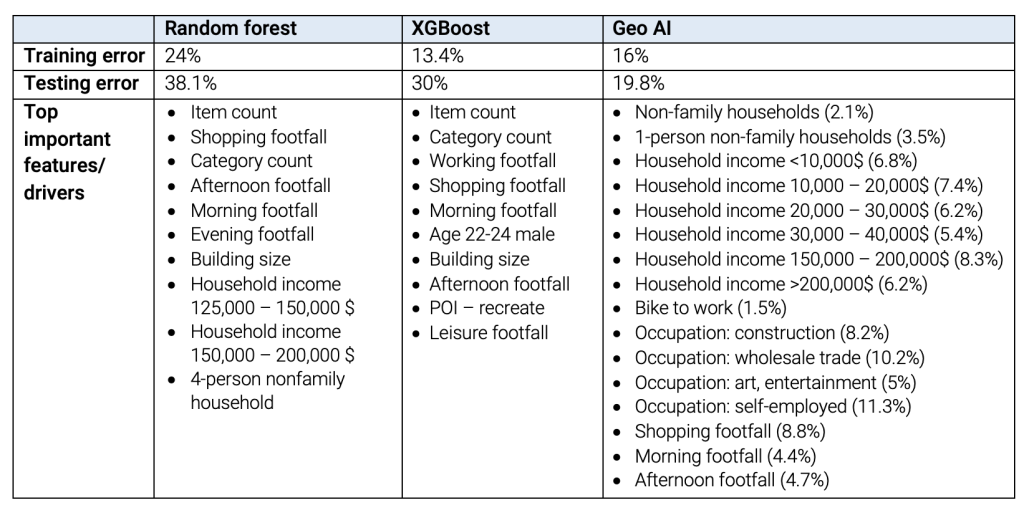
The identified attributes in the Random Forest and XGBoost models are rather limited and are restricted to the number of items, the number of visitors, and one or two socio-demographic attributes.
In contrast, the Geo AI model consists of a wide range of features, including among others store features (item count, shop type), surrounding environment (footfall at the location), and socio-demographic characteristics of potential customers. Item count, indicating the variety of liquors offered in store, shop type, and shopping footfall in the close neighbourhood are used to measure store attractivity in the gravitational model.
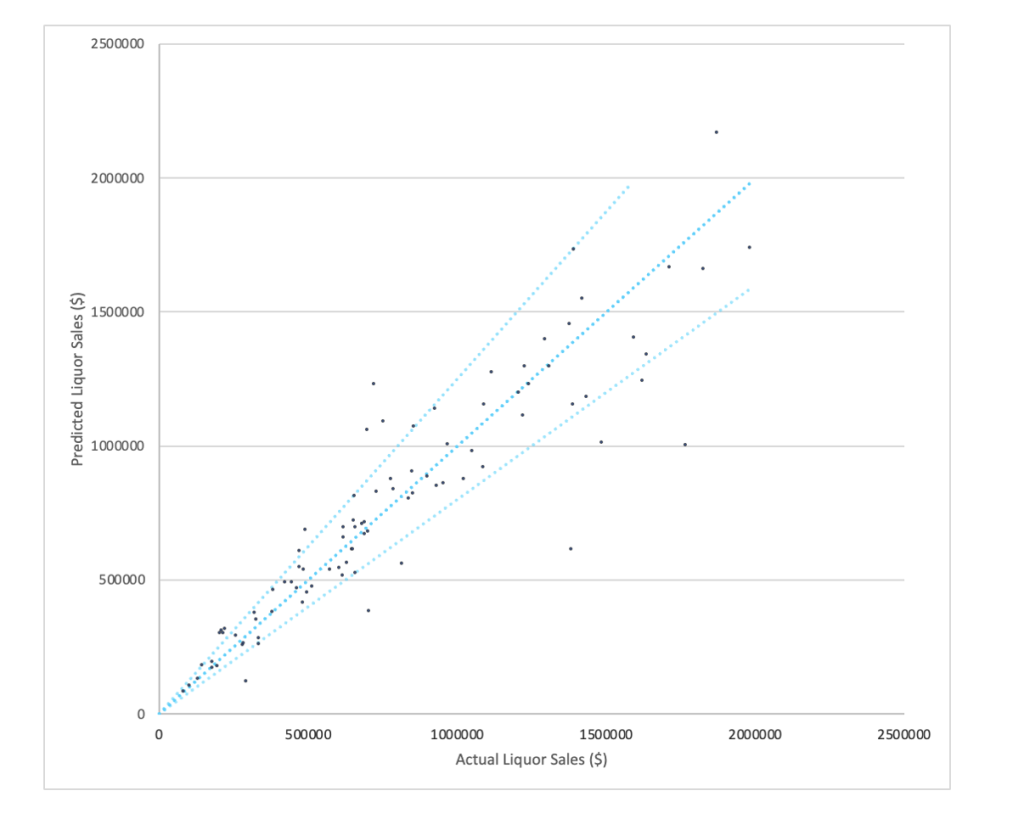
The scatter plot of the Geo AI output: The x-axis is the actual liquor sales, and the y-axis is the predicted liquor sales. The dots are nicely distributed along the diagonal line, which indicates a good prediction performance of Targomo’s Geo AI.
Visualisation of the Geo AI Success Driver Profile
Income is a major driver of the liquor sales in Hy-Vee shops. 25.8% of the sales are from households with income less than 40,000$, and 14.5% are from households with incomes greater than 150,000$. Many studies have found that low-income individuals are at higher risk of engaging in heavy and hazardous drinking, and higher income is associated with a higher frequency of light drinking.
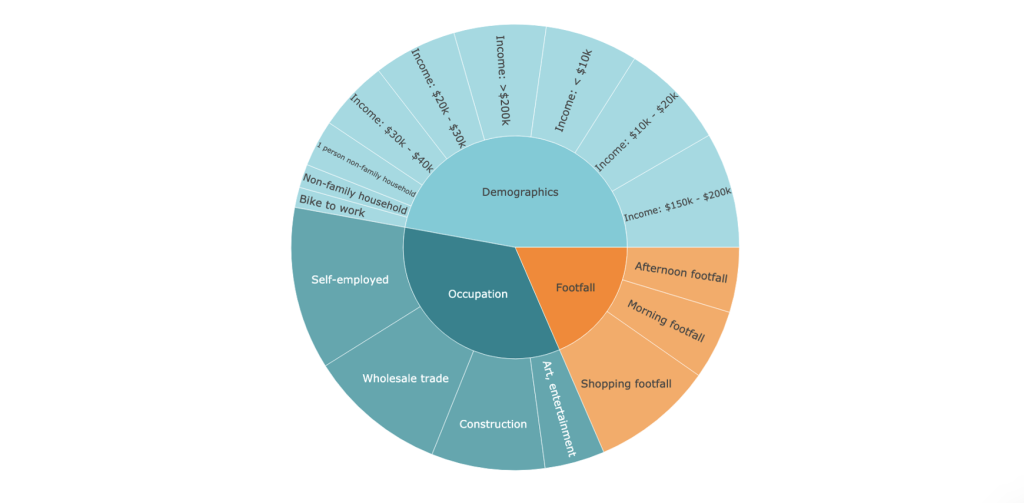
In addition to income, certain occupations have also a positive influence on liquor sales in Hy-Vee stores in Iowa. The results show that people working in construction, wholesale trade, and art industries as well as those who are self-employed are strong drivers. According to Statista, the top 5 high alcohol consumption (15 or more alcoholic drinks per week) occupations in the US 2016 are construction or mining, installation or repair, farming, fishing, or forestry, manufacturing or production, and business owner.
Among them, construction is one of the identified drivers in the model. The other identified occupations do also correlate strongly with the groups identified by our Geo AI, e.g. installation or repair, farming, fishing/forestry, manufacturing/production are often self-employed, as business owners are as well. So we can see that some drivers from Geo AI align with empirical results from research studies.
Dynamic Analytics of Hy-Vee’s Geo AI model:
Integrated in the platform TargomoLOOP, the Geo AI model delivers immediate prediction result for any potential address.
Insights
Insight #1 Good estimate of attraction strength is key
Attraction strength indicates how attractive our stores are and how attractive/competitive our competitors are. A good estimate of attraction strength can better estimate the market size and potential customers, and thus predict the revenue more accurately. In estimating the attraction strength, information about the store is key, for example, store size, sales area, store opening hours. In this case study, due to the limitation of public data, the information we have is not enough to capture the whole picture of the store attractiveness, such as the missing information about the store size. To circumvent this limitation, the building roof top data is used instead, but it is not possible to obtain this information for all stores.
Insight #2 An attractive shop location is defined by its surrounding business environment AND access to its target group
When selecting a new location to open a store, investigating the surrounding businesses is critical. What products/services do they offer? What is their vibe? Are they competitive or complementary? However, the geographic distribution of target demographics can be missed in the decision-making process. It does not matter how well suited a location is to a store if the target customer group are unable or unwilling to travel to it.
Using Random Forest and XGBoost models, it is hard to control what variables are used in the decision tree. In this case study, these two models mostly focused on the nearby environment while giving only minor consideration to the access to target demographics. The Geo AI model both put a greater emphasis on demographics, and took into account a wider array of demographic and environmental factors. We have abundant data to measure various aspects of demographic structure to support the model and future decision making.
Insight #3 Expert knowledge could be a double-edged sword in key driver analysis.
When selecting variables in the driver analysis, expert knowledge can provide insights on what key drivers can be expected based on experience or existing literature. At the same time, relying too much on expert knowledge and excluding data at the beginning that we thought is unrelated can fall into a bias trap.
Instead, by letting the model and data speak, we can gain new or unseen insights. We may find some variable we thought could be important have little to no significance, and vice versa. What we should then do is to investigate it, figure out why and explain it. Our assumptions should not interfere with the model.
The feature selection mechanism in Geo AI ensures the model suffers less from overfitting even with large number of features as the input.
Conclusion
This case study tests and compares the performance of three models, Random Forest, XGBoost, and Geo AI, as revenue prediction methods, using liquor sales data from Iowa, USA. Geo AI has the best performance among all 3 models in predicting liquor sales for Hy-Vee, having the least overfitting, the lowest testing error, and the important features in the model are more comprehensive.
Compared with Random Forest and XGBoost models, Geo AI takes greater consideration of shop feature factor variables, shop surrounding environment, local demographic structure, and mobility data making the model more reliable. In addition, Targomo’s Geo AI, a locational-based model, offers better understanding and evaluation of the characteristics of the shop location. It is possible to track the model and retrieve the prediction of each store to identify key revenue drivers. Due to its rate of overfitting and testing error, Geo AI could better predict the revenue of a new location and analyse revenue drivers.
Liquor sales prediction is one example of a Geo AI model. Geo AI can be applied in various industries, including among others retail, delivery services, food industry, and health care. Are you interested to learn more about Targomo’s Geo AI forecasting for retailers and restaurant brands, and see dynamic analytics of the Hy-Vee Geo AI model? Book a demo here
Authors: Yue Luo (Spatial Data Scientist), Gideon Cohen (Software Engineer), Luisa Sieveking (Marketing & Communications)
The Geo AI model was developed by Targomo’s Data Science Team that is dedicated to evaluate which location factors influence the business success of brands and companies, and to what extend they contribute to revenue.
Comments Off on Case Study: Sales Forecasting with Geo AI