Location scoring – also known as location rating – makes locations objectively comparable with each other and thus simplifies the search for a property or location. Relevant criteria or location factors are defined, and then normalized and combined to a comparative value (score) per location. In this way, users can quickly gain an overview of which locations meet their specific requirements. Targomo, together with Ubilabs, has developed an interactive demo that provides an exemplary location score for private real estate searches in Berlin.
Here we can add the link to Ubilabs post
1. Definition of individual evaluation criteria
The scoring model is a quantitative analysis procedure for putting several key figures, which are difficult to compare with each other, in relation to locations, regions or areas. The aim is to derive decision-supporting measures for each location. As a starting point for the scoring analysis, the evaluation criteria are determined according to the specific use case. In the example for private real estate search, we selected the accessibility and reachability of Points of Interests (POIs) and mobility as evaluation criteria.
The POIs were clustered in three categories:
Local Supply: Supermarket, bakery, pharmacy, drugstore, post office, bank, ATM, kindergarten, school, bus stop
Gastronomy: Restaurant, fast food, cafe, food court, beer garden
Nightlife: Bar, cinema, night club, pub.
Another score represents the quality of mobility in the category Transit, bringing the total number of criteria to four. To calculate a score for mobility, it was taken into account that the pure availability of a stop is not very informative. For this reason, demographic data was used to calculate the number of people who can be reached by public transport within 30 minutes.
Depending on the use case, a scoring could also be enriched with more key figures. For example, accessible playgrounds, kindergartens and parks could say something about family friendliness or recreational value. All key figures are converted into a single score value using mathematical-statistical calculations.
2. Determination of score composition and weighting
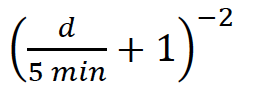
The next step is to determine how locations will be scored against the evaluation criteria. In our example of private property search, the calculation of the POI scores is based on the number of POIs that can be reached on foot within 15 minutes. To give less relevance to POIs located further away, they are weighted according to their distance in travel time, with relevance decreasing quadratically with increasing distance.
Calculation:
The relevance decreases quadratically with increasing distance
This means that POIs at 0 minutes distance are weighted 1, at 5 minutes with ¼, at 10 minutes with 1/9, at 15 minutes with 1/16 .
For the criteria Local Supply, the calculation takes into account that several POIs of the same type don’t provide additional benefit for a resident, as for example five pharmacies. Rather, what counts here is that there is at least one POI of the following types: supermarket, bakery, pharmacy, drugstore, post office, bank, ATM, kindergarten, school, and bus stop.
Since in reality not every user evaluates the respective location factors in the same way, the scoring gives the user the possibility to set the weighting of the single evaluation criteria individually. In this tool, it is possible using sliders, allowing the user to set the importance of each. As a result, all weighted score points are aggregated, resulting in a scoring measure for each location.
3. Derivation of reference values
A major challenge in location scoring is that the scores are usually distributed very unevenly. This means that most locations have a low score and only a few locations have a very high score. At the same time the aim is to ensure that the ratings are distributed in such a way that the available spectrum is covered (as completely as possible) and a meaningful range of ratings is created
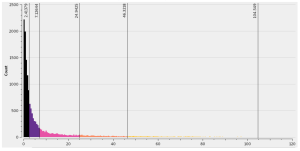
The following example shows a very simple score using the example of gastronomy where the unequal distribution of values is clearly visible. Most Places have a very low score and very few places have a very high score.
In Berlin, eat out locations are distributed unequally.
The histogram shows the strong unequal distribution.
To counteract this unequal distribution, the rating is based on percentiles, so that it always adapts to the distribution in the country, district or local area. In the location scoring demo by Targomo and Ubilabs, the user can also toggle between two different area type modes: municipality, or borough. By changing the area type, the total score is calculated whether in relation to the entire municipality, or the borough the location belongs to.
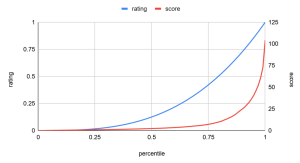
The following diagram shows the distribution of gastronomy scores and the related rating:
Scores (red) and related rating (blue) which is based on percentiles
Calculation example: A location selected by the user has the score 50 (red curve, right Y-axis). This corresponds approximately to the percentile 0.967 (X-axis). The corresponding rating is then 0.967³ = 0.9 (blue curve, left Y-axis). Values above the maximum get the rating 1.0.
4. Calculation of the rating for a coordinate
We distinguish here between “score” and “rating”. “Score” means the absolute values whereas the “rating” is a value between 0 and 1 or 0 and 100%.
In general we can distinguish between three different types of scores and their calculations:
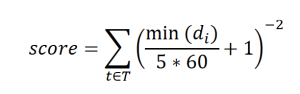
Scores that require the presence of one object per category, but that do not become better if there is more than one object (as for example pharmacies): For each day t with which the score is defined, the shortest travel time to a POI of this tag is calculated and flows weighted into the sum of the score. An API call of the POI service with list of relevant tags (categories), travel mode Walk and maximum travel time 900 seconds is generated.
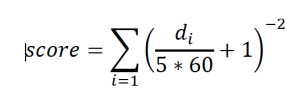
Scores where “the more the better” applies (for example restaurants): The travel time to each object of each tag is included in the score in a weighted calculation. Again, an API call of the POI service with list of relevant tags (categories), travel mode Walk and maximum travel time 900 seconds is generated.
Score where the number of people in the surrounding area is important: An API call of the corresponding demographic tags and means of transport is generated. For mobility scores, the calculation is based on the principle “the more the better”. When it comes to the proportion of a population group, such as the proportion of children and young people, a quadratically decreasing weighting is recommended. The Point of Interest Service – and of it the Reachability call – returns the POIs which are reachable around the requested coordinate in a given time with the selected means of transport – in this case 15 minutes on foot, and the travel time itself. Each object is assigned to the requested POI types based on tags. Finally, the Statistics Service is used for the Transit criteria. The service combines the accessibility calculation with statically stored socio-demographic data and calculates how many people, households etc. – depending on the selected statistics – can be reached in a given time with the specified means of transport – in this case 30 minutes with public transport.
Calculations:
Calculation of scores where more than one POI don’t have a positive impact.
Calculation of scores where “the more the better” applies.
Strengths of the location scoring model
While scoring models are originally known primarily from the banking industry when it comes to credit scores, they are also very useful in the evaluation of locations. Integration of a location scoring in maps allows users to quickly gain an overview of which properties or location are relevant for them.
Benefits of location scoring at a glance:
Individual choice of factors depending on the problem
Weighting of the factors can be flexibly adjusted by each user using sliders
Reduction of many key figures to one measure
Transparent decision support for the user
Comments Off on 4 Steps to Obtain a Meaningful Location Scoring
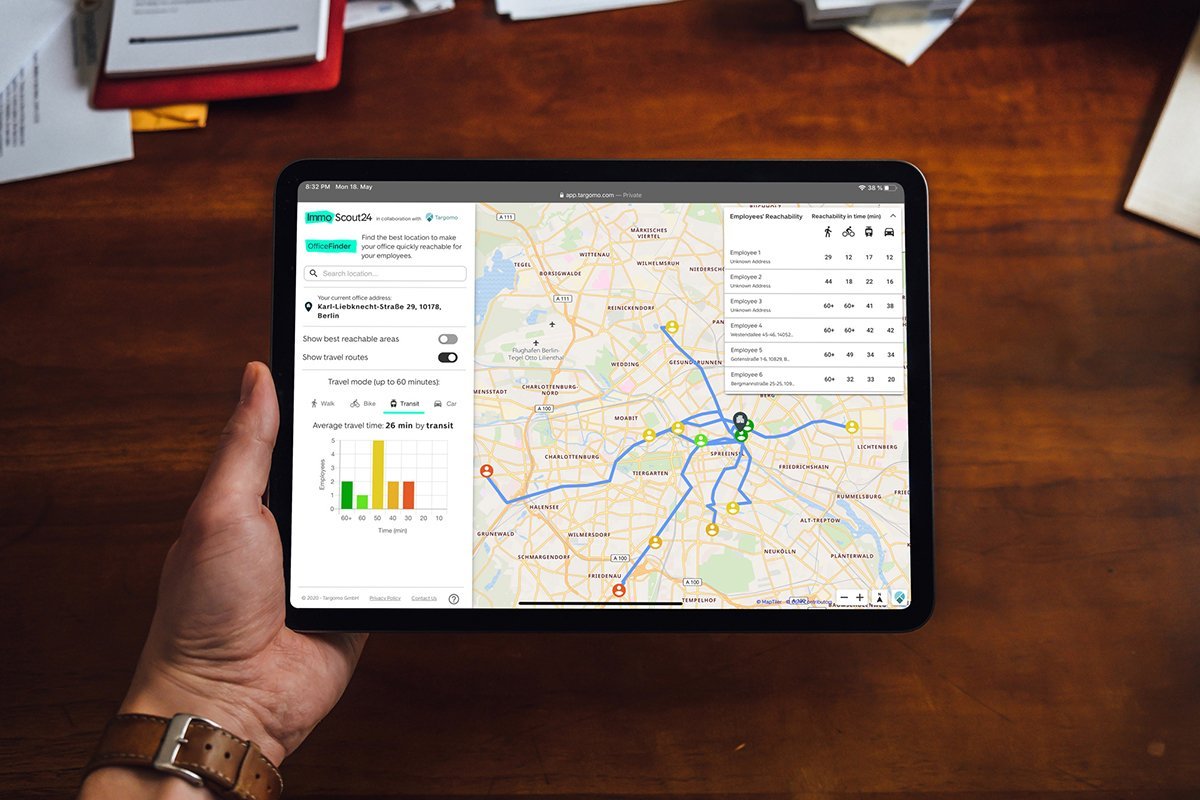
Targomo’s OfficeFinder tool is now available to customers of ImmoScout24 Gewerbe (ImmoScout24 Commercial Property). With the new OfficeFinder tool, Germany’s leading real estate portal ImmoScout24 and location intelligence specialist Targomo offer a technical solution that enables employers to take into account employees’ commute times when searching for a new office location. This makes it easy to find the “most commuter-friendly” office.
Targomo uses artificial intelligence and highly developed routing technologies to analyze an office location’s reachability. Within seconds, the tool calculates the commute times to the office for all specified employee addresses and determines whether a car, public transport, bicycle or on foot is the quickest way to reach the destination. On a map, employers can see which areas are best reachable for their employees. After they have selected a potential office location, the tool calculates the average commute time for the workforce. In addition, OfficeFinder shows for each employee on an interactive map which transportation mode is the fastest to reach the office.
“Length and duration of the commute to work impact quality of life and work-life balance. Thanks to OfficeFinder, employers looking for a new office at ImmoScout24 Commercial Property can now take this into account, and find out how commute times and distances change for employees with just a few clicks”, explains Aleksandra Petseva, Head of Product Innovation at ImmoScout24. “By integrating this innovative and data-driven tool, we are helping our users to make better and more informed decisions, thus making office selection easier”.
Patrick Schönemann, Targomo’s CEO, is convinced that OfficeFinder can improve quality of life: “More than 22 million employees in Germany need 30 to 60 minutes to get to work. Almost 5 million need more than one hour. We want to do our part to shorten these commute times. If we succeed in reducing the figures by only 5 or 10 percent, we would have more time overall that we could use at work, with our loved ones or for our hobbies.” *
About Targomo
Using artificial intelligence and big data, Targomo’s location intelligence platform analyzes geospatial data to unlock the full potential of location information for any company or organization without the need for specialized knowledge. Users gain valuable insights to increase revenues, save costs and gain decisive competitive advantages. Targomo was founded in 2013 and is based in Berlin and Potsdam. Customers in Germany and abroad are successfully using the platform: real estate or retail companies forecast the potential of locations and optimize offers or delivery routes. Public transport companies in Norway use Targomo to optimize their route planning and better adapt it to their needs. More information: www.targomo.com
About ImmoScout24
ImmoScout24 (www.immobilienscout24.de) is the leading online platform for residential and commercial properties in Germany. For over 20 years, ImmoScout24 has been revolutionizing the property market and every month supports 14 million users on their way to their new home or suitable commercial space. That’s why 96 percent of the target group knows ImmoScout24. With its digital solutions, the online marketplace provides orientation and successfully brings together owners, estate agents and those looking for property. ImmoScout24 is working towards the goal of handling property transactions digitally and, thereby, of making complex decisions easier for its users. ImmoScout24 has also been active on the Austrian residential and commercial market since 2012 and reaches around 3 million searchers every month.
A team of five Targomo engineers has been awarded in the global “Data against Covid-19” hackathon. They came in second place with a geospatial tool to analyze and visualize the capacities of intensive care bed units (ICU) in the face of the coronavirus pandemic.
Built on Targomo’s Location Intelligence platform, the technology allows authorities and hospital operators to identify risk areas and take action before shortages arise. It can be rolled out across nations and applied to other medical capacity questions as well as different areas, such child care facilities, schools and public transport.
The jury was comprised of high-profile members, including the leaders of top European innovation, investors and technology business networks. During the award ceremony, they highlighted three characteristics of the technology: The clear impact of the solution with an immediate applicability in a real crisis situation; the scalability into many countries where the same urgency can occur; and, furthermore, the potential of a product that can be expanded to other use cases.
The hackathon, which took place May 1-3, was organized by European innovation body EIT Digital. “This is by far not the first DeepHack that we organize, but it was the first fully online DeepHack”, states Chahab Nastar, Chief Innovation Officer of EIT Digital, on their website. “And it was a tremendous success. We received 312 registrations totaling 145 projects. We selected 20 projects for the final event, and we have 3 strong winners. Congratulations to all participating teams for their commitment and the high quality of their proposals.”
An international team of five Targomo engineers took part: Jacopo from Italy, Jan from Germany, André from Brazil, Daniel from the Czech Republic and Hugo from France. “This is a great achievement by our engineers, who developed this tool with a lot of engagement and passion,” says Targomo CEO Patrick Schoenemann. “Leveraging our expertise in location intelligence and artificial intelligence, they’ve demonstrated that our technology can help tackle this pandemic.”
Watch the award-winning video pitch below and see how the tool works.
The development of the technology is supported by the BMBF (FKZ 01IS18010A)
Comments Off on Award for Intensive Care Capacities Analysis in ‘Data against Covid-19’ Hackathon
The coronavirus outbreak has highlighted the need for sufficient capacities of intensive care (IC) beds. Targomo engineers have developed a tool to predict risk areas in IC capacities and take action before shortages occur. The analysis can be rolled out across nations and applied to other service coverage questions as well as different areas, such child care facilities, schools and public transport.
The covid-19 pandemic has led to a huge rise of intensive care patients who need extensive treatment in hospitals and clinics. The outbreak has forced some authorities to set up emergency hospitals or move IC patients to other regions or countries, where the virus had not yet infected many people.
Faced with this problem, Targomo data scientist Jacopo Solari and colleagues developed an analytical tool to calculate the need of IC beds or IC units at a local, regional and national level. They combined pandemic and hospital data with census figures and a reachability analysis to model demand for IC beds. Based on real-time data and assuming certain scenarios of how the outbreak could develop, they were able to predict where a shortage of IC beds could arise.
The tool, developed during an EU-backed hackathon on May 1-3, allows authorities and hospital operators to plan ahead and build up extra capacities before an outbreak expands or decide to move patients to less affected areas to free up IC beds. These steps can prevent ICU shortages, save lives and guarantee an adequate level of medical service locally and across the nation. The analysis won Jacopo and his team an award and €5,000 in prize money.
It is important to note the following: The analysis is not a prediction of future covid-19 cases in Germany, but merely a presentation of hypothetical outbreak scenarios. The current situation displays the actual, total number of active covid-19 cases in Germany, but the distribution of covid-19 patients who need intensive care treatment among hospitals is estimated. The number of intensive care patients shown only reflects the number of covid-19 patients who need ICU treatment. It does not include “normal” intensive care patients, meaning people who receive ICU treatment for different causes. The current situation is therefore not comparable to data shown by DIVI, Germany’s association of intensive care specialists, which has collected all ICU data from individual hospitals in a so-called Intensive Care Register. DIVI’s figures are subject to copyright laws and could not be included in the analysis without the organization’s permission.
The text below explains how the tool works in detail. Or, alternatively, watch the award-winning video pitch below and get a brief introduction to the tool.
Detailed demographic data, showing how many people of a certain age group live in certain geographic area
Robert-Koch Institute, Germany’s federal institute for public health and the central body to coordinate measures to contain the covid-19 outbreak:
Robert Koch-Institut (RKI), dl-de/by-2-0
Information System of the Federal Health Monitoring, 2015 / Germany’s Federal Statistics Agency (Gesundheitsberichterstattung des Bundes, 2015 / Statistisches Bundesamt)
Gemeinsamer Bundesauschuss, a federal agency which collects all types of data about Germany’s hospitals and clinics:
Quality Report of Hospitals for the year 2017. The report was published in 2019.
The Quality Report of Hospitals has only partially been used. A comprehensive overview of the Quality Report of Hospitals can be found here: www.g-ba.de/.
Only three variables were used from the report: number of hospitals and their exact locations, total number of beds per hospital, whether a hospital offers intensive care treatment or not.
The Quality Report of Hospitals is used here in conjunction with other sources of information. Therefore, the recommendations and results given do not represent an authentic reproduction of the quality reports. For a complete presentation of the quality reports of hospitals, please refer to www.g-ba.de.
Location and road data, and reachability analysis to calculate travel times from a home to a hospital
Combining data
The analysis builds on several data sets to estimate the number of IC beds needed in single hospitals:
Real-time number of active covid-19 cases and an estimation of the fraction of infected people needing IC treatment. When available, actual figures of people in intensive care can be included in the analysis of the current situation.
Geographic locations of a nation’s hospitals and clinics offering intensive care treatment and the number of IC beds available per hospital.
Census data, showing how many and where people live in a specifically defined location, known as census cell.
Reachability analysis: routing data to predict in which hospital covid-19 patients will most likely receive intensive care treatment.
Reachability and census data
The reachability of hospitals is crucial for the analysis: Patients are most likely to receive treatment in medical centers that are nearby. Because time and quick help is essential to offer relief and increase chances of survival, covid-19 patients will most likely visit hospitals in their immediate vicinity.
Combined with census data, which tells us how many people live in a certain region, the reachability analysis will show which hospitals will receive how many covid-19 patients. Simply put, locations that are nearby will attract more patients from their immediate vicinity. The tool assumes that covid-19 patients will drive a maximum of one hour to visit a hospital in their region.
The reachability analysis allows us calculate a so-called ‘ICU coverage score’ for each geographic area, which is defined as the area for which census figures have been collected. The latter is known as a census cell.
“We used reachability, or to be exact, the inverse of travel time to calculate which patients are ‘drawn’ to which hospital,” says Jacopo Solari, who holds a Ph.D. in physics. “The further away a hospital is from a census cell, the less impact it will have on the score of that cell.”
With their model, Jacopo and his team can calculate and visualize two important outcomes:
The level of IC capacities or coverage score for each geographic cell. This shows whether people in an area (a census cell) have decent access to IC beds in their immediate surroundings. It is computed as the sum of the bed balances (number of IC patients – number of IC beds) for surrounding hospitals, divided by their travel time.
The number of covid-19 patients in need of IC treatment for each hospital. It answers whether a hospital has enough IC beds available or not to treat covid-19 and other patients, who need intensive care treatment.
Visualize scenarios and take action
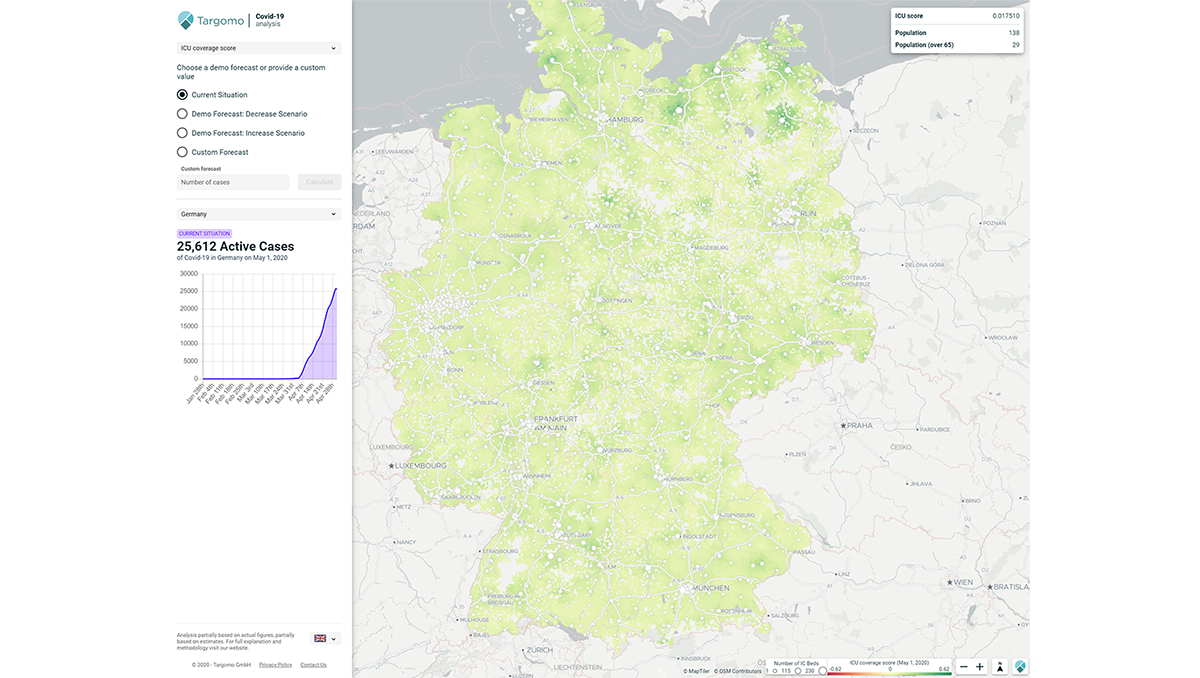
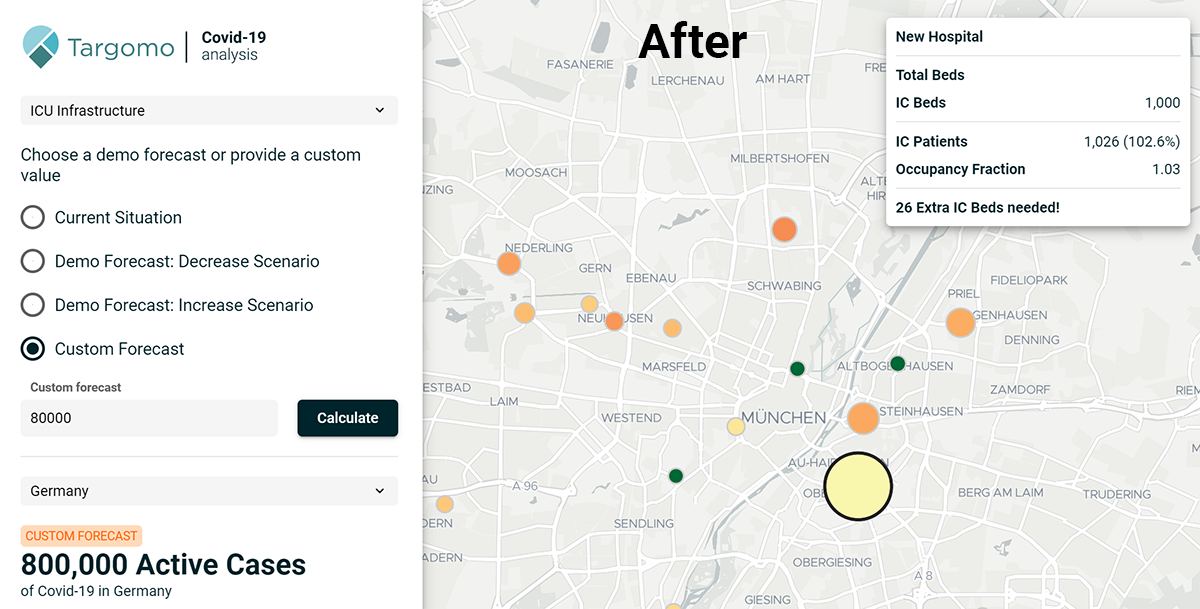
The tool will show on a map where IC coverage is sufficient, near its limit or inadequate. For Germany, the current situation is reassuring as the number of covid-19 patients needing IC treatment is well below available IC beds across the nation, as depicted in the picture at the top.
The tool’s value becomes evident when different scenarios are analyzed, specifically the ones where the number of covid-19 cases, and, subsequently, the number of people in need of intensive care treatment, rises dramatically.
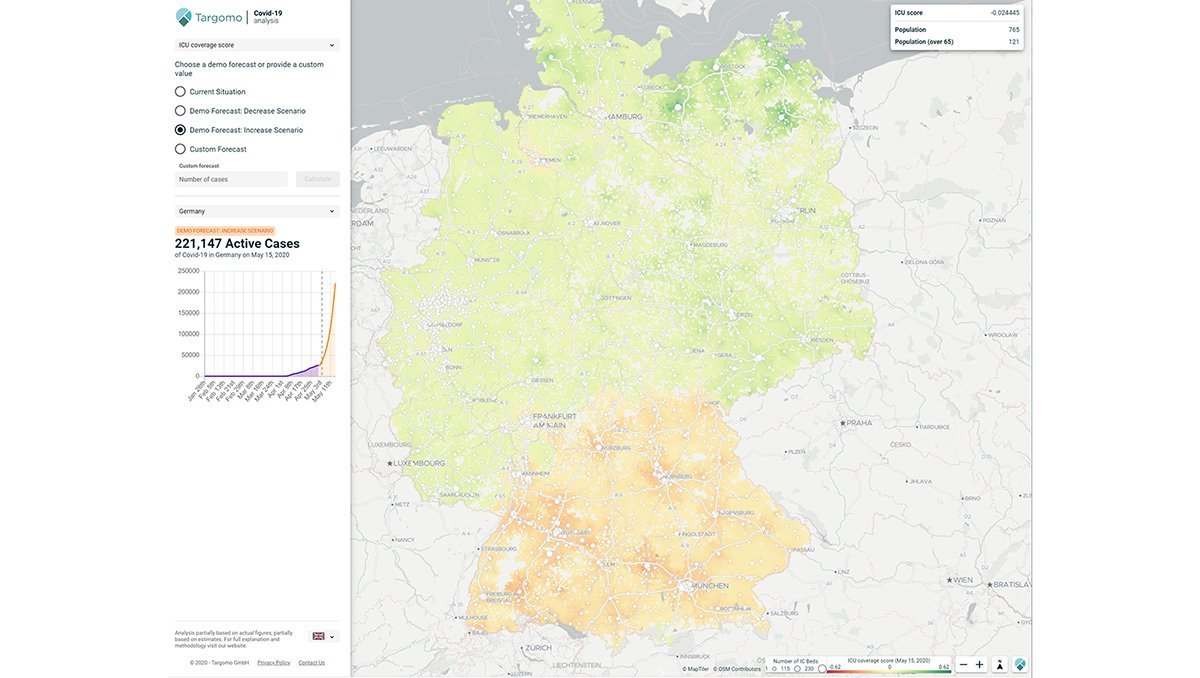
The map below shows how the German states of Bavaria and Baden-Württemberg would lack the capacities to treat covid-19 patients, who need intensive care help. Visualization helps to immediately identify the risk areas. As an additional aid, demographic details for each census cell are highlighted in the top right corner: total population at a location and the number of people over 65.
Map showing ICU coverage score for Germany assuming a scenario of an increase in the number of active covid-19 cases. G-BA’s Quality Report of Hospitals has only partially been used. A comprehensive overview of the Quality Report of Hospitals can be found here: www.g-ba.de/. The Quality Report of Hospitals is used here in conjunction with other sources of information. Therefore, the recommendations and results given do not represent an authentic reproduction of the quality reports. For a complete presentation of the quality reports of hospitals, please refer to www.g-ba.de.
Analyze individual hospitals
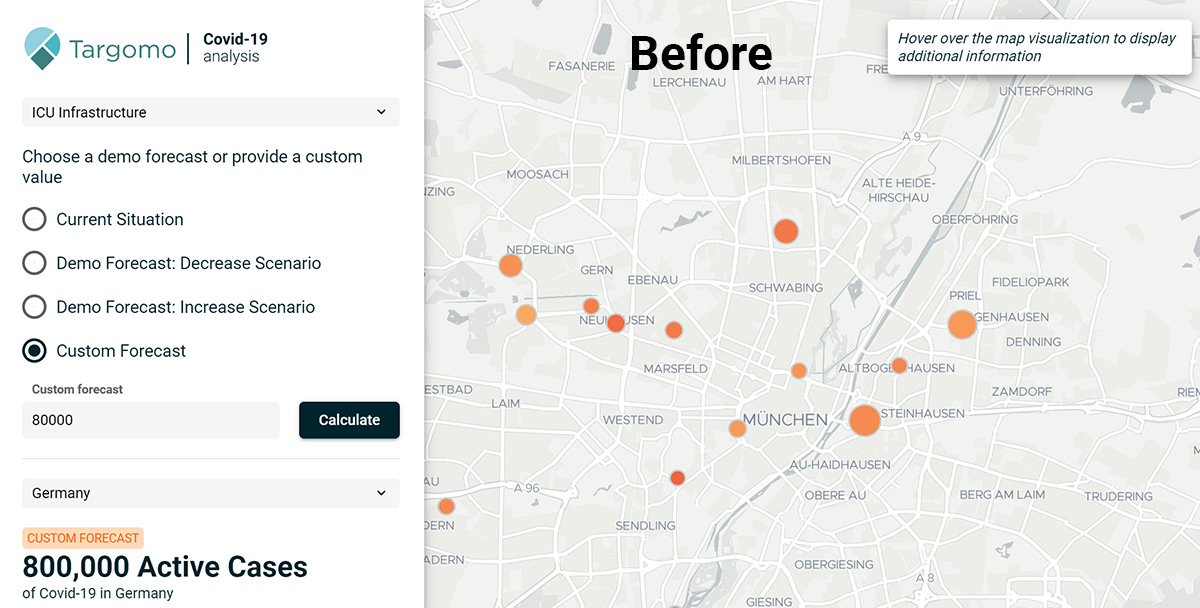
The tool is also powerful at the hospital level. The map allows users to toggle between the ICU coverage score (the map is colored) and individual hospital, displayed by the dots on the map. Once hospitals are visible, users can see how many IC beds each hospital has and whether there is shortage of beds or not. Users can add a new, temporary hospital to see how this would improve the situation, as shown in the two pictures below.
G-BA’s Quality Report of Hospitals has only partially been used. A comprehensive overview of the Quality Report of Hospitals can be found here: www.g-ba.de/. The Quality Report of Hospitals is used here in conjunction with other sources of information. Therefore, the recommendations and results given do not represent an authentic reproduction of the quality reports. For a complete presentation of the quality reports of hospitals, please refer to www.g-ba.de.
The tool also allows users to pick a random outbreak scenario by entering the number of active covid-19 cases in a country, in the example, Germany. The ‘Custom forecast’ can be used by epidemiologist to put their own predictions into the tool. They can then instantly visualize the effect of their own state of the art disease-spreading model.
Scalable: Other use cases
The analysis does not only apply to ICU service quality, but for any type of medical service, such as the number of places to treat people with heart problems or geriatric ailments. By changing the data sets, the same analysis and insights can be obtained. The tool also allows users to analyze service quality questions outside the medical realm, for instance the number of child care or school places in a city, whether the quality of education is deemed sufficient (as measured by exam scores).
International use is also easily feasible, by taking data from other countries or regions. For instance, if the state of New York has data available, the analysis could be made in a couple of hours. The analysis can be made for any country in the world as long as the necessary data is available.
Methodology
Jacopo and his team have used different data sources for the analysis. A full list is given further down, but the most important data sets are the number of covid-19 cases provided by Germany’s federal health institute, or Robert-Koch Institute, and an estimation fo the number of intensive care beds per hospital. The latter figure is derived from the number of ICU beds per German state and then proportionally allocated to each hospital in a state, by dividing it by the total number of beds in that state. It is assumed, that the number of intensive care beds is linearly related to the total number of (normal) hospitals beds.
The analysis assumes that a certain number of covid-19 patients needs intensive care treatment. Currently, this number is set at 0.0075, meaning that 0.75% of active covid-19 cases end up in hospital. This number is based on the most up-to-date figure from the Robert-Koch Institute.
Data sources
Destatis, Germany’s federal statistics office:
Detailed demographic data, showing how many people of a certain age group live in certain geographic area
Robert-Koch Institut, Germany’s federal institute for public health and the central body to coordinate measures to contain the covid-19 outbreak:
Number of cases over time per at the state level
Gesundheitsberichterstattung des Bundes:
Number of ICU beds per Bundesland
Gemeinsamer Bundesauschuss, a federal agency which collects all types of data about Germany’s hospitals and clinics:
Number of hospitals and their exact locations
Total number of beds per hospital
Whether a hospital offers intensive care treatment or not
OpenStreetMap:
Location and road data, and reachability analysis to calculate travel times from a home to a hospital
The analysis would improve if DIVI, Germany’s association of intensive care specialists, would grant access to its real-time data of all intensive care units in Germany. DIVI has collected an overview of all of total available IC beds and occupied beds in Germany and updates the list daily.
Comments Off on Covid-19 Pandemic Management: Identify Risk Areas in Intensive Care Capacities
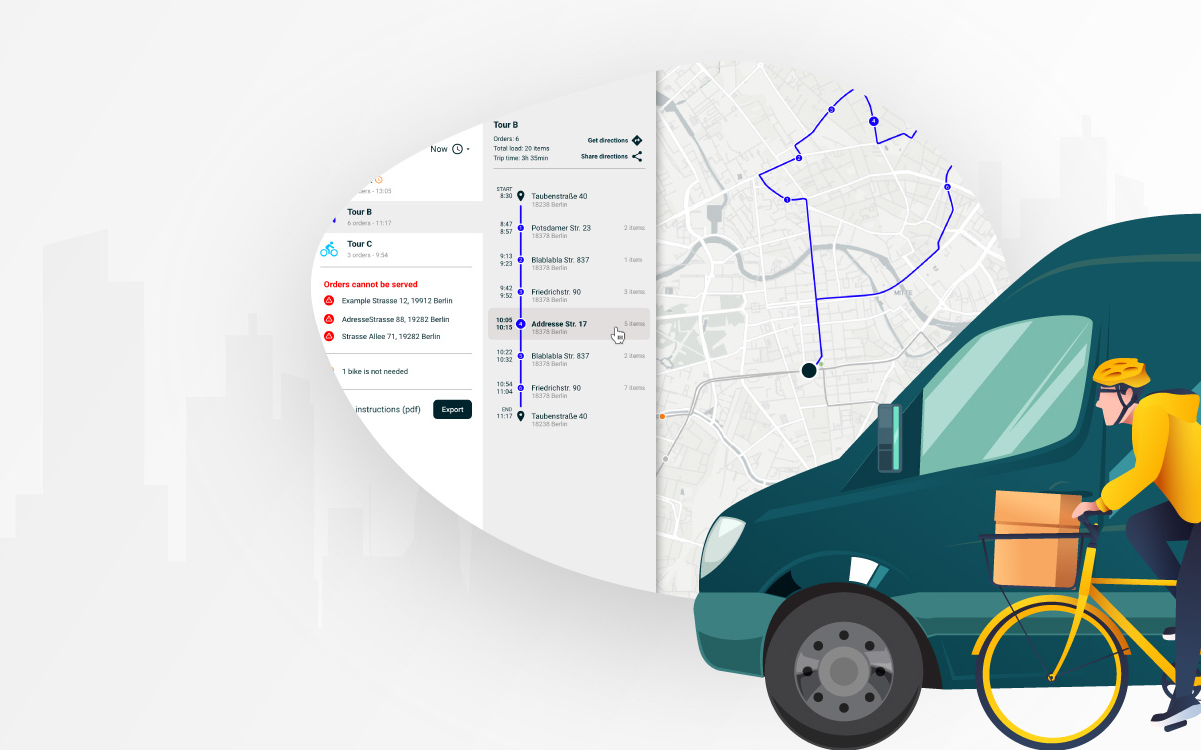
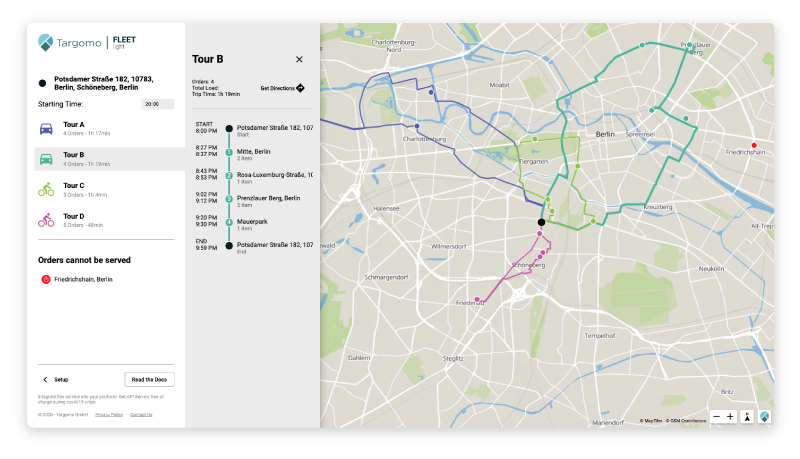
To help businesses, organizations and people during the coronavirus pandemic, Targomois offering a route- anddelivery-planning service. The tool, TargomoFLEET light, willhelp users toquickly plan optimal routes for one or several vehicles, including bicycles, whether to deliver goods door-to-door or plan patients visits. The platform is available here: app.targomo.com/fleet
The coronavirus pandemic has forced many shops and restaurants to close their doors and triggered a boom in delivery services. To help local businesses and organizations get their products and services to customers and keep their business running during the crisis, Berlin-based location intelligence startup Targomo has developed a route- and delivery-planning service. With just a few clicks and free of charge, users can schedule the best routes for their deliveries.
While ordinary navigation services only allow to plan routes from A to B with some stopovers and for a single vehicle, TargomoFLEET light calculates routes for up to 30 stops and fleets of up to five vehicles and bicycles each. For both types of transportation, the user can specify load capacity, the maximum time per trip, and the average time with a customer.
“In many countries, the lockdown has a devastating effect on retailers and other businesses,” says Patrick Schoenemann, CEO of Targomo. “We’d like to use our expertise in geoanalytics, artificial intelligence and routing to help those affected and keep their business running. I am proud of the Targomo team, which has shown great commitment in the development process.”
Calculating the Optimal Delivery Route
The idea for TargomoFLEET light was born during a hackathon, which the Targomo team held over the weekend. The goal was to use location intelligence technology during the coronavirus crisis in a meaningful way and to help those suffering from the pandemic.
The tool uses complex routing algorithms to calculate the optimal delivery routes within seconds, and make the delivery as efficient as possible. Not only retailers can benefit from the delivery and route planner. The technology also allows doctors, nurses or health authority employees to determine the optimal routes for their customer or patient visits within a very short time. TargomoFLEET light is now available.
“Find out how we used Isaac Newton’s Theory of Gravitation to answer a complex location based question: Why are so many Berlin parents struggling to find a Kindergarten place for their children? We found that Kindergartens throughout the city are unevenly distributed.
Since 2018, every child in the German capital is entitled to free child care from their first birthday onward. Still, this new law has not solved the problem that has become very common among young parents. The threat of “Kita-Notstand” (“Kindergarten Emergency”) has recently made headlines. It threatens the attractiveness of Berlin for young parents and newcomers. And here at Targomo we have also felt this problem. After all, we are a young company and some of our co-workers just had children and some are struggling to find a place for their child.
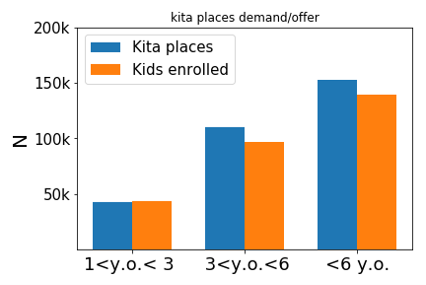
We were wondering: What is the story behind the Kita-Notstand? Is there maybe something we are missing here? As a first step we decided to look at the demand and supply of Kita places and it looks like there are enough places for children in the German capital. In total 139.856 kids are enrolled in Berlin’s Kitas today and the whole city offers 152.559 Kita places (destatis.de, kita-suche.de).
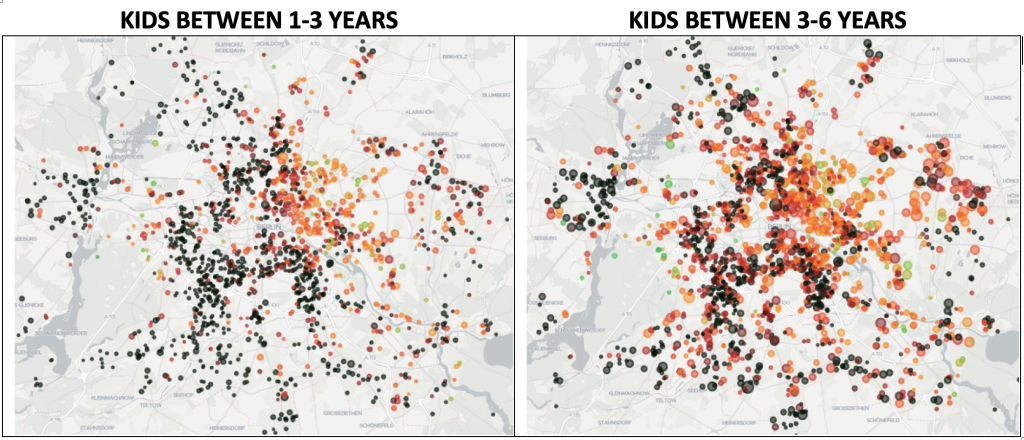
Comparing demand and offer of kita places for different age groups
So we asked our data magician Jacopo to further examine the problem from a location intelligence perspective. We assumed that the locations of Berlin’s Kitas were suboptimal. To test this idea he used a concept based on Newton’s law of gravitation particularly helpful in solving this puzzle.
Newton’s law of gravity says: “every mass attracts every other mass in the universe, and the gravitational force between two bodies is proportional to the product of their masses, and inversely proportional to the square of the distance between them.” In short: The gravitational force between two bodies gets smaller, the further apart they are. And larger bodies have a stronger gravitational force than smaller bodies.
Our model treats Kita locations as bodies that attract people. Larger Kitas attract more children. The longer people must travel to a Kita, the less they are attracted to it. With our gravitational model we can predict the number of kids applying to each Kita and thus their degree of overcapacity.
Very early in the process we decided to follow two strands of analysis. First, we wanted to see what would happen if parents chose the closest Kita to their homes? Second, what if all kids eligible for a Kita spot applied for it? How would this change the current picture?
Case I: What if Parents Chose the Closest Kita?
But in order to get the full picture we needed to focus on two crucial categories: Age groups and location. A Kita in your neighborhood is not helpful if it only serves kids older than 3 years, but your child is 2-year old. A Kita with a free space for your child that is situated at the other end of the city is similarly unrealistic.
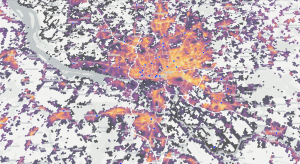
To understand the two factors better, let’s take a look at the following maps. The visualization of our gravitational analysis reveals the problems in the distribution of Kita places across the city. Black dots represent Kitas that are over capacity, meaning there are more Kids in its surroundings than the Kita can service. The size of the dots signifies the degree of overcapacity; how many children a Kita would have to accommodate to serve the demands of the parents living close by. Red dots equal 75% occupancy. Comparing these maps shows that the picture varies drastically between age groups.
Kids younger than 3, especially in the South-West of the city, face a dire situation. For kids older than 3, there are enough Kita spots but there is a slight mismatch. Kitas in the East are on average only 75% occupied while Kitas in the West and at the outskirts of the city cannot serve all the children in their proximity. We calculate that 52 % of Kitas serving children between 1 and 3 years old are too small for the demand in their direct proximity. Or to put it differently, 48% of Kitas do not have enough children living in their proximity, that means that parents have to travel to these Kitas to find a place for their children. This situation is less dire for older children but still 30% of Kitas are over capacity.
Case II – What if every Child Applied to a Kita?
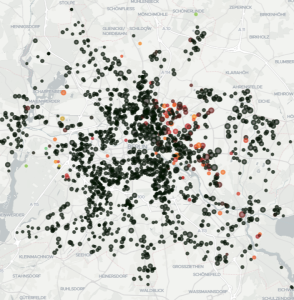
In Berlin, every child over the age of 1 is entitled to a place in a Kita. The question we were asking is: what if every family in Berlin claimed their right to a Kita place? The result is dramatic. According to our census-based analysis, today about 35.000 kids in this age group who have a right to a Kita, don’t have access to a place.
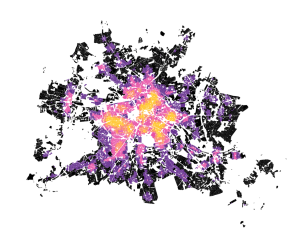
The picture that emerges makes the problem crystal clear:
About 35.000 kids over the age of 1 don’t have access to a Kita, even though they are entitled to.
What’s next?
Children are the future. Providing equitable access to Kita benefits the entire community.
The reality on the ground probably resembles a state that’s somewhere in the middle of the two cases we considered. Giving easier access to Kitas in close vicinity to parents homes would incentivize more parents sending their children to a Kita. On the other hand, we know that not every parent will send their child to the Kita for a variety of reasons. But nobody wants a world where parents are forced to quit their jobs because the only available Kita is too far away from their home.
We understand that there are many more layers of complexity to any public policy decision that make running a city that much more complex. But we believe that visualizing the scope of the problem is incredibly powerful as a starting point for policy. With our Location Intelligence solutions, we give decision makers a platform to make decisions that are informed by data and state-of the art technology.
The study was presented by Jacopo Solari at the Urban Mobility Sympoisum – Karten, Daten, Geovisualisierung on 11. Oktober 2019 at CityLAB Berlin, organized by Technologiestiftung Berlin, supported by Senatskanzlei Berlin.
Comments Off on The real story behind Berlin’s Kindergarten Emergency
Oslo’s public transport authority Ruter uses location intelligence to easily analyze the impact of network changes and to win support from politicians and commuters. With TargomoLOOP, Ruter can quickly see how its network should evolve to serve more people, more efficiently.
Transit Authorities Face Many Challenges
As in many big cities, the public transport authority in Norway’s capital has to respond to demographic developments, changes in the usage of transportation means, and constructions projects. In the Oslo metropolitan area, home to more than 1 million people, rerouting lines has a large impact: Ruter’s contractors handle more than 380 million journeys per year and operate around 250 metro, tram, bus and ferry lines.
The municipality-owned company turned to Targomo in 2015 to analyze the impact of new bus stops or redirected routes and determine the optimal number of stops on a line. Later, they also used the platform to find the best location for a new electric mobility hub, examine whether citizens can easily access newly developed areas, and define the potential market when changes or expansions are planned.
[quote text=”This platform helps us to provide the best transit system possible, and that is something the whole community and our customers will gain from.” type=”long” name=”Trude Flatheim” role=”Strategic Traffic Planner at Ruter#”]
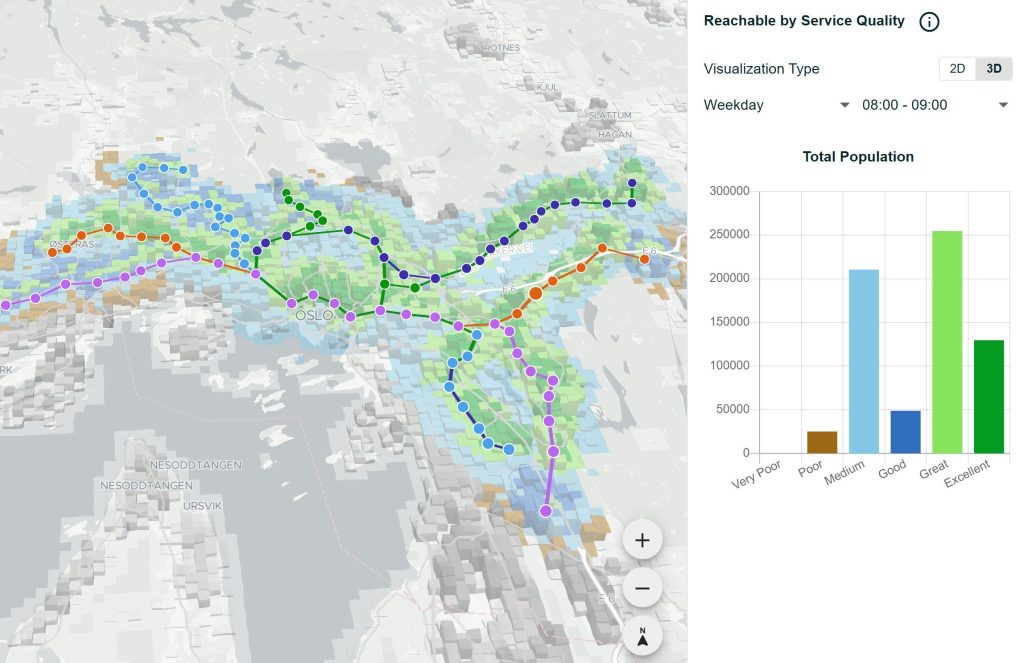
Ruter combines its own network and passenger load data with census figures in Targomo’s platform, which calculates the travel time to the nearest transit point from any place in the city. At an aggregated level, it shows how many people can reach a transit stop or any stop of a line within ten minutes on foot, for instance.
With these sophisticated, yet easy-to-use calculations, Ruter can quickly forecast the impact of network changes, analyze different scenarios, or examine the effects of a completely new line.
“It is much easier to see how many people are affected,” said Trude Flatheim, a strategic traffic planner with Ruter. “This platform is simpler than what we used to have. Everyone can go in there and make these analyses in a couple of minutes instead of hours.” Even people who are not skilled in using geographic information systems (GIS) can quickly get started. Flatheim and her colleagues can use the application every time when a network change is discussed and even show the analysis live to stakeholders.
The blue and green shaded areas show which customers have decent access to Ruter’s five metro lines based on frequency and the stops’ reachability. Graphic source: Targomo / Ruter
Maps and Numbers Build Stronger Arguments
The platform helps Ruter to win support from commuters and politicians in the municipalities of the Greater Oslo Region to make network changes, whether temporary or permanently. In fact, people can better understand the results of the analysis because they’re visualized on a map.
For example, Ruter has used the results to explain to commuters why certain network changes made sense, even when these meant longer travel times for some travelers. “We have to make people see the whole picture; it all comes down to this cost-benefit analysis,” Flatheim said. “We have to do that all the time. It’s easier to show them when we have the maps and tools.”
The Mobility Needs of a City Are Rapidly Changing
Transit authorities need to analyze the potential of areas where new development, such as a new hospital, is planned. How many people could use the new location? How will they get there? Ruter is now able to plan and decide whether to offer more services in new areas even before construction has started.
Mobility behavior and policies also change, requiring novel initiatives. Together with the Norwegian Public Roads Administration and the City Environment Agency in Oslo, Ruter has used Targomo’s platform to find a suitable location for a new mobility hub, where people can pick up and share electric vehicles, bikes and scooters. The site is closely located to several bus stops. “It is a way how we think about arranging mobility in the future, offering new modes to move around in the city,” Flatheim said. The hub, part of an initiative to make Oslo a carbon-neutral city, was taken into operation in August 2019.
By incorporating new data sets in Targomo’s platform, Ruter’s forecasts become even more reliable and up to date. The transportation authority is currently testing mobile phone usage figures to make dynamic predictions based on citizens’ movements in the city throughout the day and week. These figures could accurately forecast when and where the need for buses, trams, trains or ferries would be biggest.
Targomo supports Ruter in offering a customer-centric network and responding adequately and timely to new modes of transportation as well as policy changes. Managing a highly complex network has become simpler.
APIs to map thousands of POIs can slow down or crash your system. Targomo’s new service solves this issue by using vector tiles in the MVT format, in addition to clustering. We will explain how these features work and how you can access them.
Visualizing POIs as Vector Tiles
As with many other Points of Interest APIs on the market, our previous version was at times slow to visualize all the data on a map, especially when selecting a large area (zooming out). Furthermore, we previously only offered the possibility to request POIs in JSON format. That made the integration of our POI service difficult as one needed first to parse our service JSON response in order to add it into one’s application.
To remove these hurdles, we’ve created a new request method to our API which gives you the possibility of retrieving POIs in the MVT format. It is a machine-readable data specification that can be integrated into various map applications such as Mapbox GL JS. These applications divide your map into smaller parts or tiles and request the needed information for each tile. Adding the possibility of requesting the POIs as MVTs provides you a faster, more reliable and responsive visualization of them on your maps. We’ve used this technique to build our interactive POI tool, launched in December.
The request is quite simple to configure inside your map application. All you need to do is to set the “MVT request” URL as tiles source. For instance, a GET request URL that enables you to visualize the POIs that contain the tags amenity=restaurant and shop=clothes looks as follows:
The Targomo POI tool above uses the techniques described in this article. Click and drag the map or zoom in to see a specific location.
How to Write Your MVT Requests
As you may have seen in the example above, you must define which OpenStreetMap tags you want to search for in the request URL. Indeed, an OSM tag is composed of a key and a value (defined with the syntax “key=value” in the request). To make our service as fast and user-friendly as possible, we have limited our API to 16 OSM keys, which are similar to categories. These keys (such as shop, amenity, tourism, office) are the ones we found relevant from a “Point of Interest” perspective. There is no need to request OSM objects according to their landuse tag for example. The list of supported keys is available via this request: /pointofinterest/osmTypes.
To further aid performance, the number of OSM tags that you can request drops when you zoom out. Starting from zoom level 7, the more you zoom out, the fewer OSM tags you can request at once.
The request has two other features. First, it is possible to request all the values at once for a given key by using a wildcard, the asterisk sign “*”. The following request, for example, would render all types of shops on a map:
Secondly, you can request the POIs as hexagons instead of nodes thanks to the parameter layerType. Supported values for this parameter are: node or hexagon. This might be helpful as a background layer of POI density in a city.
Another useful tip: If you want to know which information is retrieved by our MVT request, you can replace .mvt (which is only machine-readable) by .geojson to get the result of the request in the human-readable GeoJSON format and hence debug your application more easily.
Clustering: Having a Quick Glimpse of All POIs When Zooming out
For wide areas such as entire cities or countries which contain a lot of POIs, the amount of data that needs to be displayed on the map can get huge very quickly: displaying all of the bus stops (highway=bus_stop) in Germany represents 313k points for example. It can jeopardize the performance of your application. Furthermore, loading thousands of points on a single map with a big zoom-out level is useless as many of the points are very close to each other. There are not even enough pixels to distinguish them.
To improve the loading time and the MVT response size, our API service clusters the POIs. In other words, it slices the requested tile in multiple, very small areas and gathers the POIs that are in the same area. It only retrieves then one point per area with the mean coordinate of the POIs and the number of POIs that it contains (thanks to the attribute numOfPois of the point).
Clustering allows us to generate a quicker overview of the POIs located in a large area and improves the readability of the map by aggregating several POIs into a bigger marker. Zooming in still gives the user all the data points he or she wants to display, as shown in the illustration below.
From far away, POIs are clustered and displayed as large dots when they are close to one another. Zooming in reveals that a big dot represents several POIs.
Requesting Similar POI Tags Easily Thanks to Our Hierarchy
It is sometimes quite tedious to find all the OSM key/values you need to visualize. For example, if you’d like to display all the places where a health care service is provided you need to look at the OSM Wiki and produce the exhaustive list of the OSM tags that correspond to a healthcare service: doctors, clinics, hospitals, dentists, pharmacies, and so on.
Our API and tool make your job easier thanks to a POI Hierarchy. We have built a hierarchical classification of POI tags that allows you to directly request a group of related POIs.
The result of this request is a JSON array with a tree of POI groups. Each POI group can either be a category that contains one or several subgroups or a simple POI tag with a key and a value. For example, the group “Services” with the ID g_service is composed of 4 subgroups, including the group “Healthcare” (g_healthcare), which itself is composed of 9 simple tags such as amenity=hospital or amenity=doctor.
Feel free to give us some feedback if you think some OSM tags are missing in our POI Hierarchy. We would be happy to enhance it thanks to you!
Requesting POI Information
In the MVT response, the POI tags (such as “source”, “opening_hours”, or “addr”) are not all retrieved to reduce the size of the response and hence increase the loading speed of the map.
However, after displaying all POIs in a certain area for a given group, you may need to get all the OSM tags of a certain POI. Thanks to our info request, it is easy. You can make this request as follows:
/pointofinterest/info/{poiID}
It will return all OSM tags that this OSM object contains (such as its name, address, or opening hours) and all the groups which this POI belongs to.
Added Value: Combining the POI Service with Our Other Features
To truly unlock the power of POIs, you could combine our POI service with our routing service. We could, for example, request the POI from a certain group and request the travel time between these POIs and a given source. This would allow us to calculate the travel times from an office building to public transport stops within a 10-minute walking distance, for instance. On our developers pages, we offer an example of how you could achieve this.
We are excited to learn how you will use our new POI service. Please drop us a line on our contact page. To get started, click on the icons below. Happy coding!
Integrate Targomo’s tool into your application and create a powerful way to visualize POI data.
Former Google manager Patrick Schoenemann has joined Targomo as CEO to expand the Berlin startup’s presence in the location and data analytics market. It is another high-level addition to the Berlin-based software maker, which had already attracted a former Nokia director and raised funding from venture capitalist Earlybird.
Patrick Schoenemann joined Targomo as chief executive officer and managing director on February 1 to strengthen the startup’s offering to businesses and public organizations. Patrick had been building up Google’s operations in Europe since 2006, running various positions within the Google Maps Enterprise business.
Targomo offers sophisticated mapping and location software, allowing managers to make intelligence business decisions based on location data. For example, the software predicts revenues of retail stores, forecasts the attractiveness of new offices before they are constructed, or optimizes public transportation networks to deliver the best possible service to commuters. Targomo’s cloud-based software is also able to analyze vast amounts of data to plan and update logistics routes, making sure goods are delivered on time and at minimal costs.
The Berlin-based startup has already won a wide range of customers across different industries and countries. Its clients include Oxford Retail Consultants in Britain, French telecoms group Orange, Dutch real estate platform Funda, Oslo’s public transportation authority Ruter, and German beverages retailer Getränke Hoffmann, among others.
“As an internationally experienced business leader, Patrick will expand our global position.” said Henning Hollburg, Targomo’s founder and managing director. “He has a deep understanding of geospatial information, and how businesses and public departments could use this data to generate insights and predictions to serve their customers. With his experience and background, Patrick is a natural fit for Targomo. It will be his mission to lead Targomo to sustainable growth and make us the market leader for location intelligence. His presence will allow me to focus on improving our technology.”
Scaling up
After 14 years with Google, Patrick felt inspired by Targomo to take the next step in his career and lead the Berlin-based startup. “Targomo offers state-of-the-art software to analyze and answer highly complicated location questions. I am deeply impressed how Targomo pioneers location intelligence and artificial intelligence, yielding extremely valuable insights. These will help organizations to forecast what customers need at what time and where exactly,” said Patrick. “This is the next chapter of how location-based services will help organizations to plan their future. I am looking forward to taking part in this exciting endeavor and work together with the team to bring Targomo’s services to clients across the globe. It is a unique chance to build up a company with a highly advanced technology that serves organizations and people at the same time.”
[quote text=”This is the next chapter of how location-based services will help organizations to plan their future.” type=”long” name=”Patrick Schoenemann” role=”CEO at Targomo”]
Targomo has steadily expanded and received funding from European venture capital firm Earlybird in 2018. Last year, Targomo launched TargomoLOOP, a stand-alone platform which managers and employees without a coding background can use to gain insights into how to improve performance. In the same year, the company also hired Chand Malu, an engineer in information technologies who has worked at Nokia in Finland and India, and several tech companies in Germany.
“Following Earlybird’s participation and Chand’s engagement as senior product manager, Patrick will help us to further scale up our operations and bring our customers the location insights they need to gain a competitive advantage in fast moving markets,” said founder and managing director Henning. “At the core of our services is a routing technology that allows us to know exactly how much time people need to reach a location. By combining this reachability analysis with socio-economic demographics, data about movements and points of interest, and proprietary figures we can predict the performance of network changes and expansions.”
In 2013, Henning Hollburg founded Targomo together with Marc Hildebrandt, a successful German tech entrepreneur who supports Targomo as Executive Chairman and with his holding German Deep Tech. Before establishing Targomo, Henning completed his studies in Potsdam and Karlsruhe focusing on Cartography and Computer Science. The idea for Targomo came from a university project at the renowned Hasso Plattner Institute in Potsdam while Henning was writing his Master’s Thesis about the interactive analysis of reachability in large transportation networks. Henning dedicated his thesis to this topic after he had tried to find an apartment that he could reach quickly from his university.
About Targomo: Bringing together advanced location analysis & artificial intelligence, Targomo helps organizations generate data-based insights and forecasts to boost performance. Founded in 2013 and based in Berlin and Potsdam, Targomo offers location intelligence solutions that convert complex geospatial research into actionable insights. These allow customers to optimize their retail networks and predict performance, deliver better public services, and to improve real estate search and logistics routing. More information: www.targomo.com
About German Deep Tech: The German Deep Tech Group has been founded by serial entrepreneur Marc Hildebrandt. Together with the Hasso Plattner Institute for Digital Engineering (HPI) as excellence partner, the holding converts outstanding research results in software engineering, advanced analytics and information cartography into scalable growth companies, developing them sustainably. The portfolio includes several deep tech startups, among them Seerene, an AI-based end-to-end software analytics platform, Targomo, which leverages location intelligence to optimize business decisions, and Point Cloud Technology, a platform for automated point cloud analysis based on machine learning. More information: www.germandeeptech.com
About Earlybird: Earlybird is a venture capital investor focused on European technology companies. Founded in 1997, Earlybird invests in all growth and development phases of a company. Amongst the most experienced venture investors in Europe, Earlybird offers its portfolio companies not only financial resources, but also strategic and operational support as well as access to an international network and capital markets. Earlybird manages separate funds focussing on digital technologies in Eastern and Western Europe as well as healthcare across Europe. With over EUR 1 billion under management, seven IPOs and 24 trade sales, Earlybird is one of the most successful venture capital firms in Europe. More information: www.earlybird.com
Not for publication: For more information, interview requests, or high-resolution images, please contact Gilbert Kreijger, marketing and communications manager, Targomo Email: gilbert.kreijger [at] targomo.com
Comments Off on Google Manager Joins Targomo as CEO to Expand Startup’s Location Analytics Services
Targomo has launched a tool to visualize POIs (points of interest) around the globe and instantly see where restaurants, shops, cinemas and hundreds of other locations are locally distributed. The data stems from OpenStreetMap and everyone can easily embed it as a map into their website.
Immediately See the Big Picture
Points of interest — from supermarkets to cinemas, from schools to transit stops — greatly shape the character of a neighborhood, a city or even a country. Being able to easily examine their patterns can deliver valuable insights into people’s movements, local preferences, as well as urban planning.
This is why POIs are an integral part of Targomo’s location intelligence projects: They allow retail and real estate managers, city planners, journalists and tourists to immediately understand that area in terms of commercial appeal, public service level or cultural life.
Targomo developed the tool to quickly display thousands of POIs of distinct categories on an easy-to-use-map. It provides access to more than 30 million data points gathered by the global OpenStreetMap community.
Illuminating at Every Level
In dealing with so many data points, the main challenge is to render information at every zoom level. Cluttering the map with thousands of data points would otherwise make it difficult to draw conclusions. With Targomo POI, the visualization remains informative both at street level as well as from a national perspective.
“We can easily show what makes neighborhoods, regions or even countries unique,” said Henning Hollburg, founder and managing director of Targomo. “With a single map it is clear where a city’s shopping hotspots are or where ice skating is popular. This is highly valuable information for property managers, businesses, advertisers, or consumers moving to a new city.”
Ice skating is quite popular in the Netherlands – or its fans have simply been more active in registering ice rinks in OpenStreetMap than in other countries. Click and drag the map or zoom in to see a specific location.
Embed POIs into Your Website
Targomo POI is available as a ready-to-use website, which builds shareable maps instantly. Do you want to visualize all childcare facilities in London within your blog article? Or assess the distribution of competitors for your business network in an unknown market?
Simply embed the map, including your selected POIs, by copying the URL and adding it as an iframe to your website. The freely available data, which OpenStreetMap contributors collect, is continuously expanding and updated every minute.
Add POI Power to Your Own Map App
The technological basis of the tool is the Targomo API, which is free of charge at entry level. If you are a developer, you can use Targomo’s APIs to easily include the POI data in your online maps. Furthermore, you can use it in combination with other services, such as Targomo’s travel time analyses. With this, for example, you can filter POIs by travel time. Your map searches will be much more interactive, and you can enhance your applications with location intelligence.
Curious? Visit the POI app and check points of interest in your area or visit the API documentation if you’re a developer.
We use cookies on our website. They provide us with web analytics, helping to give you the best possible experience on all pages. To learn more and see a full list of cookies we use, visit our Privacy Policy
We use cookies on our website. They provide us with web analytics, helping to give you the best possible experience on all pages. To learn more and see a full list of cookies we use, visit our Privacy Policy.
These cookies help us understand how you use the website — which pages are most visited, how long users stay, and how they navigate. All data is anonymous. Enabling these helps us improve the site.
These cookies track clicks, scrolling, and how you interact with content. They allow us to analyze usage through heatmaps and session recordings. You can disable these if you prefer not to share this type of data.

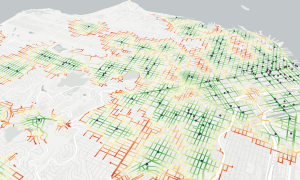


 The blue and green shaded areas show which customers have decent access to Ruter’s five metro lines based on frequency and the stops’ reachability. Graphic source: Targomo / Ruter
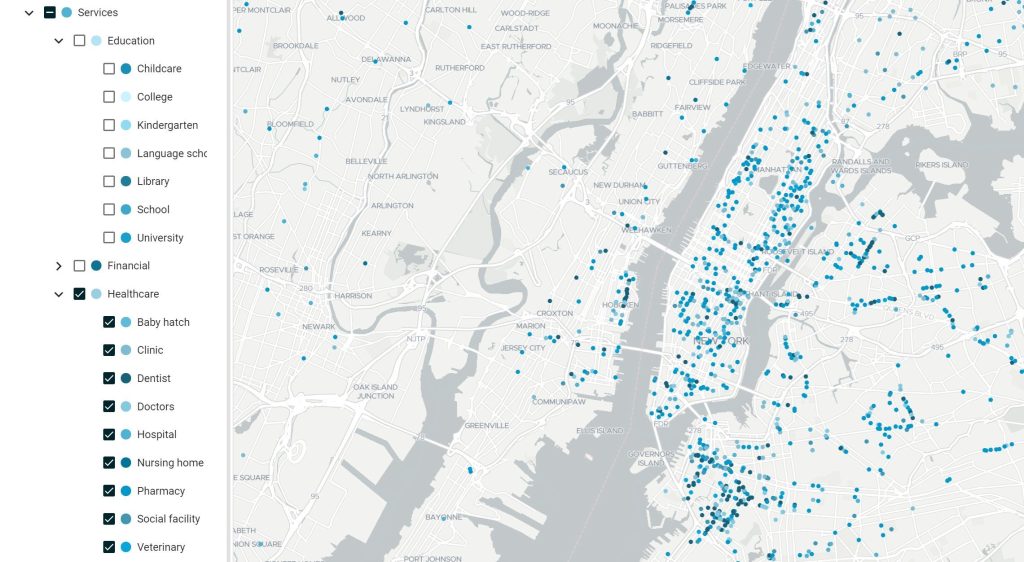 Our POI hierarchy makes it easy to display related POIs.