







The businesses and services around a location help explain its role in a neighbourhood. Points of Interest (POI) data maps these places, from supermarkets and cafés to gyms, schools and transport stops, revealing direct competitors and complementary destinations.
Targomo puts these POIs into context by combining them with socio-demographics, footfall, vehicle traffic, accessibility and your own business data. With curated competitor datasets and brand matching, expansion teams can assess the surrounding offer alongside local demand and movement patterns to understand how a potential site fits their concept.
What Is POI Data?
A point of interest is a specific place, such as a shop, restaurant, gym, school, railway station, etc. POI data records its geographical location and categorises it for analysis, with brand information where available.
For expansion teams, this helps answer practical questions:
- Which direct competitors operate nearby?
- Which complementary businesses and services surround a site?
- Where are relevant commercial clusters or gaps in coverage?
- How does a candidate location compare with successful existing sites?
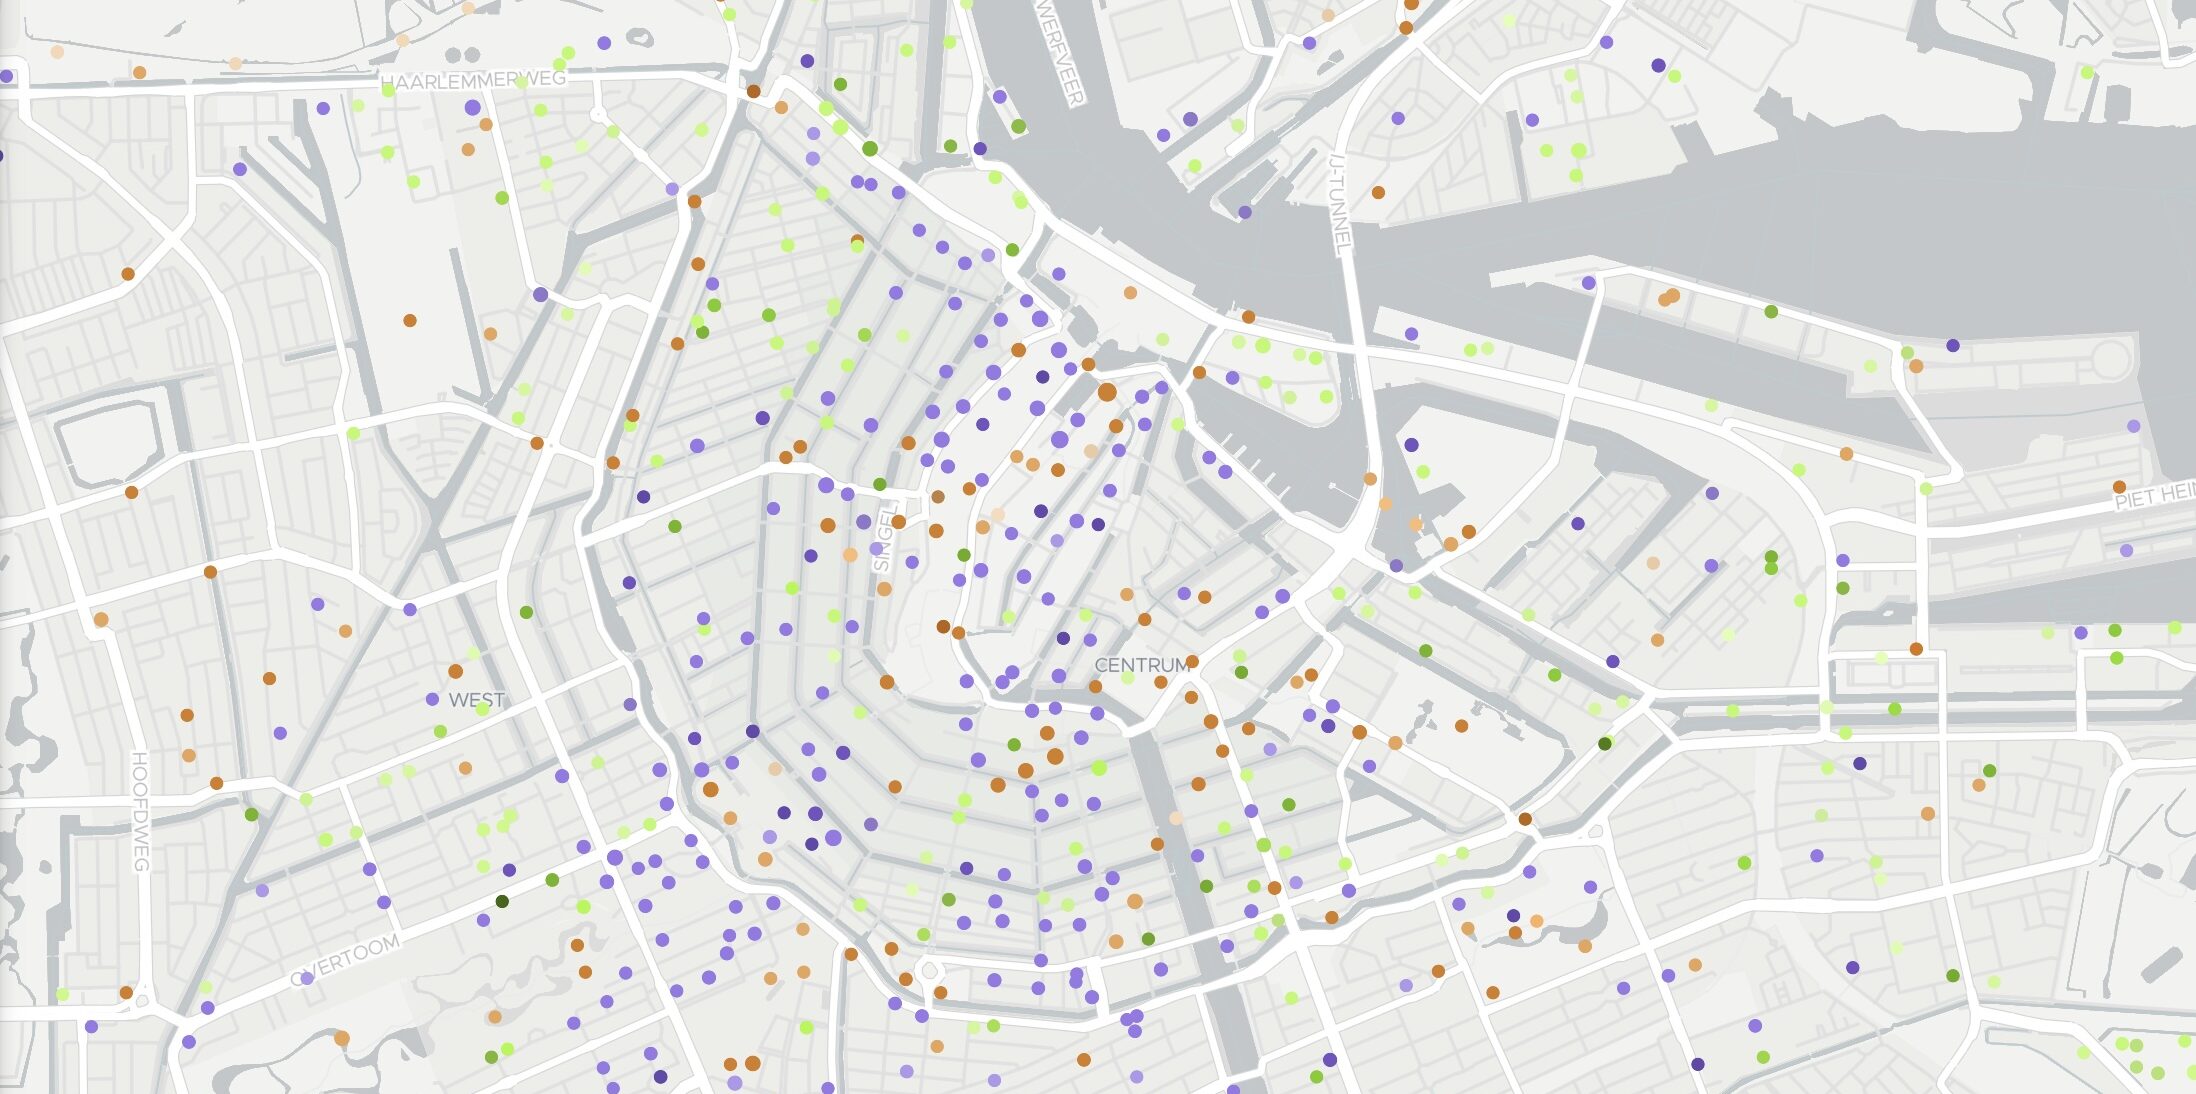
Targomo provides access to more than 82 million POIs sourced from OpenStreetMap. Its category and subcategory hierarchy lets teams explore broad sectors or focus on specific business types.
Explore POI Data Demo in Berlin
This demo shows hostels, bicycle rentals and fast-food locations, with each colour representing a category. Select a point to view more details, or click “Explore this map” to investigate further.
Understand Local Business Clusters With POI Analysis
Two sites in the same city can serve very different purposes. One may sit within a fashion district; another may be surrounded by offices, gyms and everyday services. The mix and concentration of POIs helps teams assess how an area fits their concept.
In the Marseille example below, clothing shops cluster around Noailles and Rue Haxo, while bars are spread across several smaller hubs. These patterns reveal a concentrated shopping district alongside a more dispersed nightlife offer.
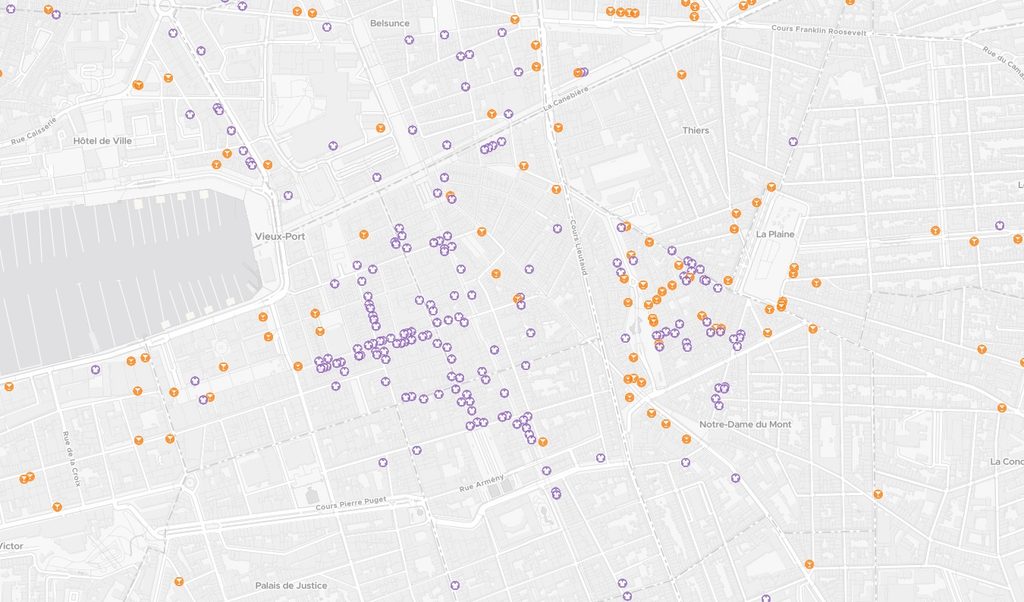
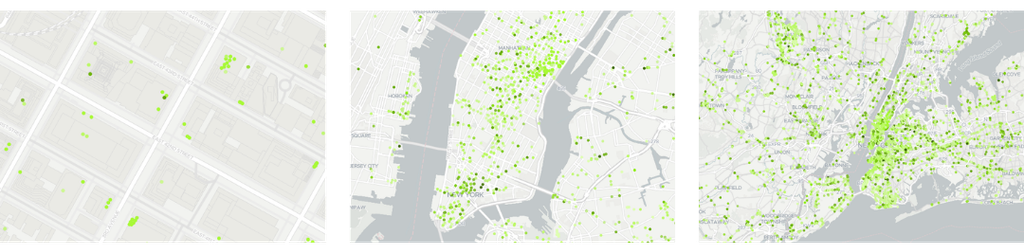
Targomo makes these patterns visible at different scales. Individual points show the surroundings of a specific site, while aggregated hexagons help identify concentrations across districts and regions.
Visualising POIs on a map helps reveal patterns at different scales. Individual points show the surroundings of a specific site, while aggregated hexagons highlight concentrations across districts and regions.
Analyse Competitor Locations and Market Coverage
Useful competitor analysis starts with knowing which operators matter to your concept. Targomo helps clients find and analyse their direct competitors through brand matching covering more than 16,000 brands worldwide, complemented by curated industry datasets.
Travel-time analysis adds context to these locations. Road connections, river crossings and pedestrian routes influence how easily customers can reach competing businesses. Targomo combines competitor data with walking, cycling, driving and public transport catchments, allowing teams to compare candidate sites using consistent criteria.
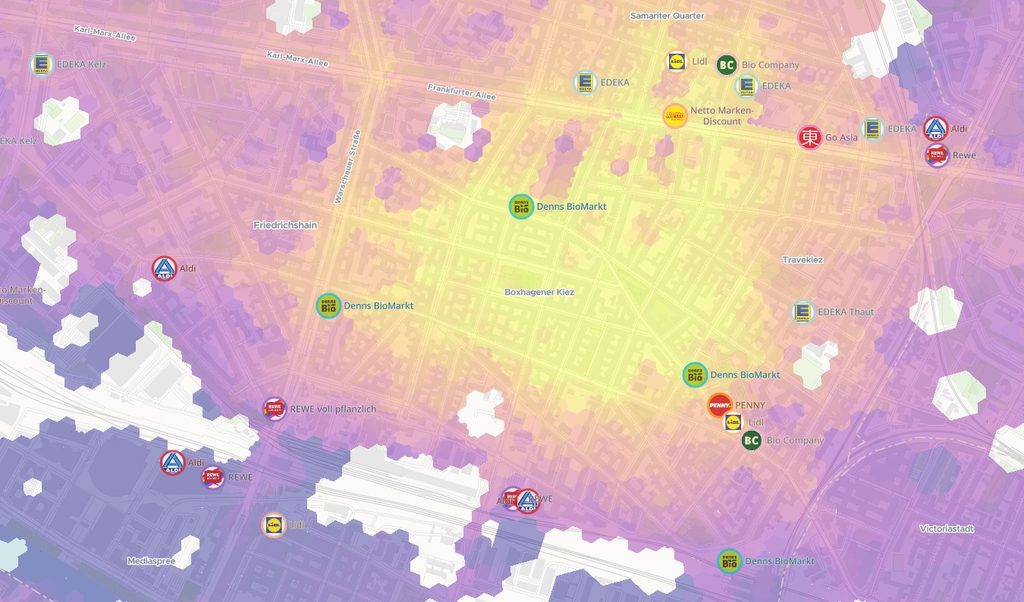
A gym operator could assess competing facilities within a ten-minute drive, while a convenience retailer could examine supermarkets within walking distance. This helps teams identify competitive clusters and potential white spaces, then evaluate them alongside local demand, accessibility, and their own network.
Analyse Customer Data Within Location Catchments
Import your customer, store or transaction data to see how existing and potential sites relate to your customer base. Targomo lets you calculate customer counts and other KPIs within defined travel-time catchments, alongside relevant POIs and competitors.
This helps to compare locations consistently, evaluate how well your network covers your customers, and identify areas with potential for expansion.
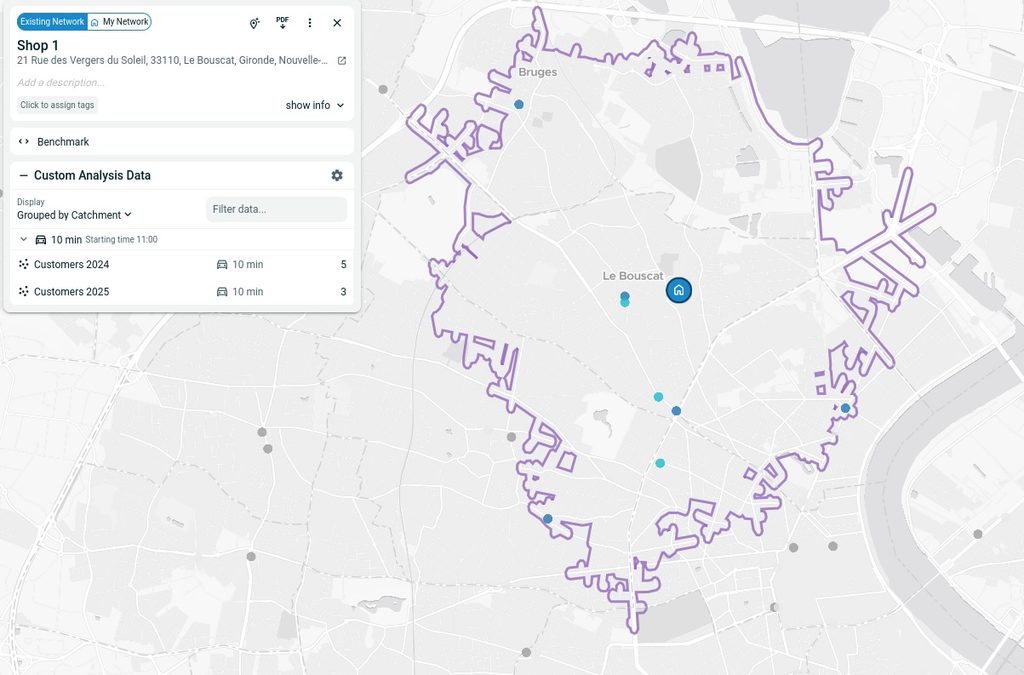
Customer counts aggregated within a 10-minute drive-time catchment alongside the surrounding POIs.
Turn POI Data Into Location Insights With Targomo
The businesses and services surrounding a location help shape its potential. Understanding their relevance means looking at competitors and complementary destinations alongside local demand, movement patterns, and accessibility. Targomo brings these layers together.
Why Choose Targomo’s POI Data?

Transparent sourcing
Global POI coverage from OpenStreetMap, complemented by selected curated datasets and validated third-party sources where available.

Relevant competitor data
Support in finding and providing direct competitor information, including established sector databases.

Consistent structure
Categories, subcategories and brand matching that support comparison across sites and markets.

Connected analysis
POIs combined with socio-demographics, footfall, vehicle traffic, travel-time catchments and your own business data.
Global POI coverage is organised through categories and brand matching, then enriched with curated competitor datasets relevant to your business. In TargomoLOOP, you can analyse this information alongside socio-demographics, footfall, vehicle traffic and your own customer and performance data.
Whether you are comparing candidate sites or reviewing an existing network, this combined view helps you assess competitor coverage, understand the surrounding area and identify opportunities for further investigation.
You May Also Be Interested in