For the successful performance of shops, supermarkets, restaurants and public services it is essential to know how many people could potentially visit your location. Anonymous movement data makes it possible to see how many people frequent a specific location or area, and predict the potential customer base.
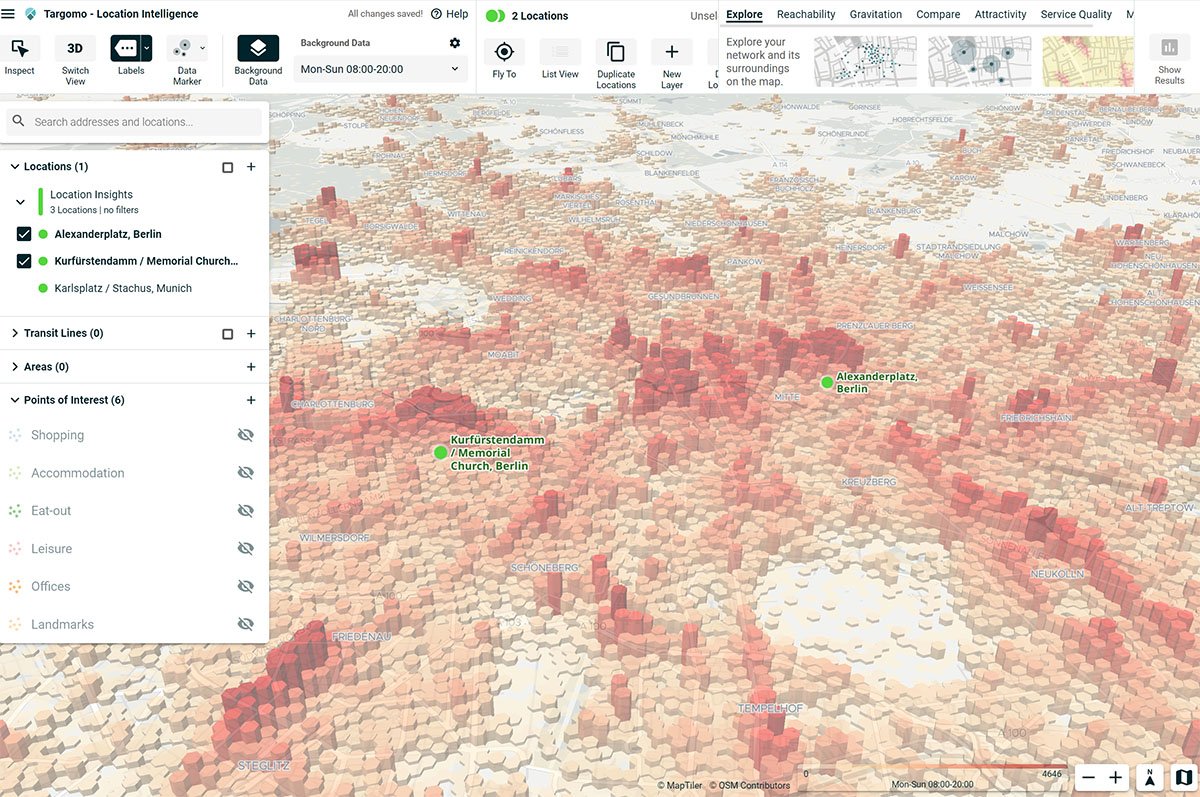
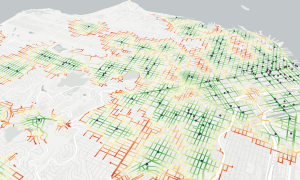
The redder the area, the more people visit that location for at least 15 minutes. Figures measured from Monday through Sunday, 08:00 am to 08:00 pm.
Based on actual measurements of people who spend at least 15 minutes at a certain location on a given day, Targomo’s location intelligence platform TargomoLOOP now offers such movement figures, which are an indication of footfall. This data comes in addition to many other figures available on the platform, such as population statistics, income groups and consumer types. LOOP stands for LOcation Optimization Platform.
Let’s examine some movement figures for a hotspot in Berlin: Alexanderplatz, or Alexander Square. From 8:00 am to 8:00 pm, every day an average of 32,901 people are within a 10-minute walking distance of Alexanderplatz. The square is home to dozens of stores, including a large shopping mall and department store, and it is a major transfer hub for commuters, who arrive by train, metro, tram and bus. The figure does not reflect the number of travelers or passers-by in that area, which is estimated at around 250,000 per workday. These commuters typically spend less than 15 minutes at the station, and are less likely to go shopping in the area.
Movement data allows retailers and restaurant owners to compare different locations, and decide which of these are most attractive in terms of potential footfall. Furthermore, city planners and public service managers use the data to see if a location needs more public infrastructure, such as transportation stops or parks. Contrary to street scanners or manual counters, which are limited to a fixed number of streets, movement data gives a comprehensive overview of all locations in Germany and abroad.
If we’d like to compare Alexanderplatz’s movement data to other locations, Targomo’s platform shows that another shopping hotspot in Berlin, the crossing of Kurfürstendamm and the Kaiser Wilhelm Memorial Church, attracts 27,545 people per day on average between 8:00 am and 8:00 pm from Monday to Sunday. Munich’s central Karlsplatz, also known as Stachus, draws 33,499 people per day in that time frame.
In addition to population statistics and so-called street scanners or counters, which measure pedestrian traffic, movement data is an important indicator of potential footfall. The figures are based on people who have given permission on their devices (typically smartphones) to be tracked anonymously, and are in full compliance with Germany’s and Europe’s strict data and privacy protection laws. It is assumed that each device represents one person. In TargomoLOOP, the data is labeled as GPS-based population.
Movement figures are available for Germany, Austria and Switzerland for different time frames and days of the week, allowing a detailed overview of how many people stay at a certain location. Data for other countries is available upon request.
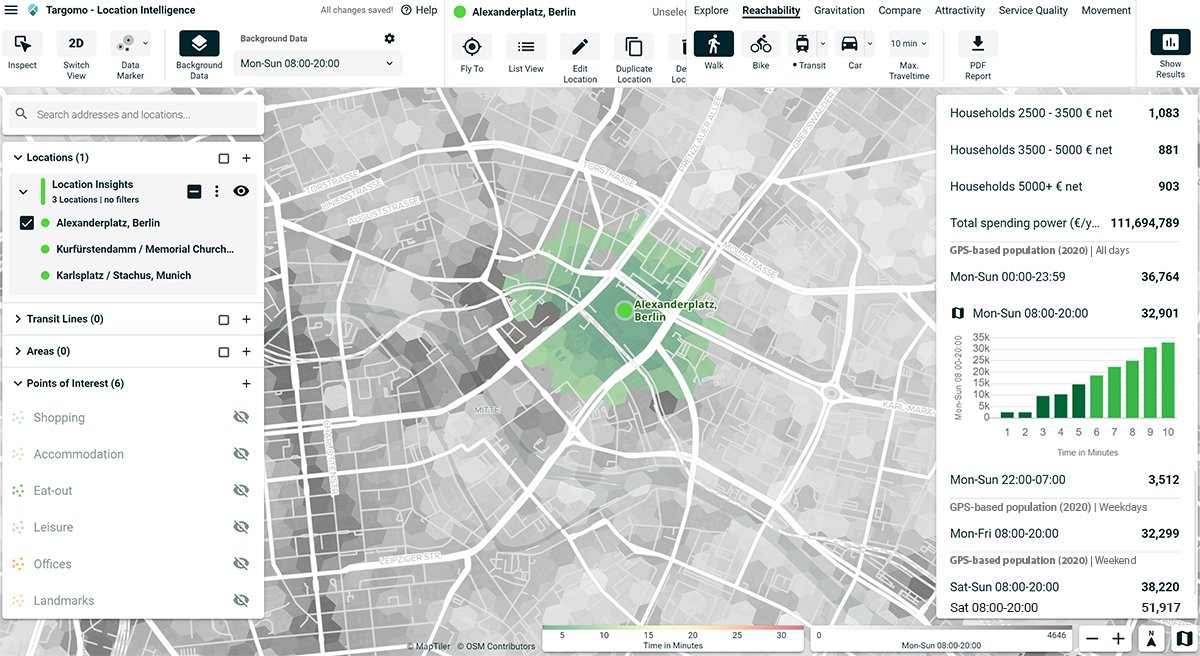
Location intelligence platform TargomoLOOP is able to visualize and calculate the catchment area on a map for different demographic and target groups, and takes transportation means into account. The green-colored area above shows how many people are within a 10-minute walking distance from Alexanderplatz and spend at least 15 minutes at the same location. Figures are daily averages measured from Monday through Sunday for the time interval 08:00 am to 08:00 pm.
Alexanderplatz’s reputation as a shopping destination becomes clear when looking at visitor numbers for Saturdays only: the number jumps to 51,917 for the time frame from 08:00 am to 8:00 pm (bottom figure in the table on the right-hand side).
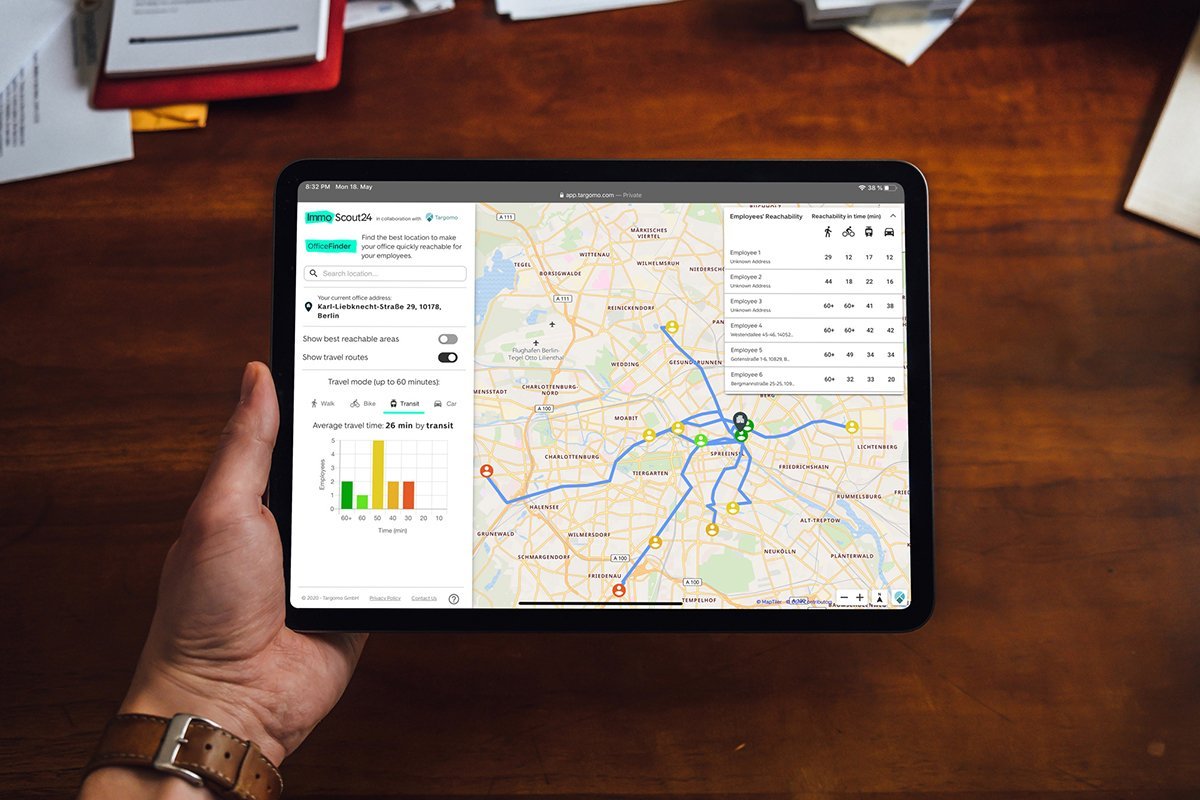
Targomo’s OfficeFinder tool is now available to customers of ImmoScout24 Gewerbe (ImmoScout24 Commercial Property). With the new OfficeFinder tool, Germany’s leading real estate portal ImmoScout24 and location intelligence specialist Targomo offer a technical solution that enables employers to take into account employees’ commute times when searching for a new office location. This makes it easy to find the “most commuter-friendly” office.
Targomo uses artificial intelligence and highly developed routing technologies to analyze an office location’s reachability. Within seconds, the tool calculates the commute times to the office for all specified employee addresses and determines whether a car, public transport, bicycle or on foot is the quickest way to reach the destination. On a map, employers can see which areas are best reachable for their employees. After they have selected a potential office location, the tool calculates the average commute time for the workforce. In addition, OfficeFinder shows for each employee on an interactive map which transportation mode is the fastest to reach the office.
“Length and duration of the commute to work impact quality of life and work-life balance. Thanks to OfficeFinder, employers looking for a new office at ImmoScout24 Commercial Property can now take this into account, and find out how commute times and distances change for employees with just a few clicks”, explains Aleksandra Petseva, Head of Product Innovation at ImmoScout24. “By integrating this innovative and data-driven tool, we are helping our users to make better and more informed decisions, thus making office selection easier”.
Patrick Schönemann, Targomo’s CEO, is convinced that OfficeFinder can improve quality of life: “More than 22 million employees in Germany need 30 to 60 minutes to get to work. Almost 5 million need more than one hour. We want to do our part to shorten these commute times. If we succeed in reducing the figures by only 5 or 10 percent, we would have more time overall that we could use at work, with our loved ones or for our hobbies.” *
Using artificial intelligence and big data, Targomo’s location intelligence platform analyzes geospatial data to unlock the full potential of location information for any company or organization without the need for specialized knowledge. Users gain valuable insights to increase revenues, save costs and gain decisive competitive advantages. Targomo was founded in 2013 and is based in Berlin and Potsdam. Customers in Germany and abroad are successfully using the platform: real estate or retail companies forecast the potential of locations and optimize offers or delivery routes. Public transport companies in Norway use Targomo to optimize their route planning and better adapt it to their needs. More information: www.targomo.com
ImmoScout24 (www.immobilienscout24.de) is the leading online platform for residential and commercial properties in Germany. For over 20 years, ImmoScout24 has been revolutionizing the property market and every month supports 14 million users on their way to their new home or suitable commercial space. That’s why 96 percent of the target group knows ImmoScout24. With its digital solutions, the online marketplace provides orientation and successfully brings together owners, estate agents and those looking for property. ImmoScout24 is working towards the goal of handling property transactions digitally and, thereby, of making complex decisions easier for its users. ImmoScout24 has also been active on the Austrian residential and commercial market since 2012 and reaches around 3 million searchers every month.
For more information, please contact:
Targomo, Gilbert Kreijger or Luisa Sieveking
ImmoScout24, Silke Birkholz
Integrate Targomo’s reachability technology into your platform?
A team of five Targomo engineers has been awarded in the global “Data against Covid-19” hackathon. They came in second place with a geospatial tool to analyze and visualize the capacities of intensive care bed units (ICU) in the face of the coronavirus pandemic.
Built on Targomo’s Location Intelligence platform, the technology allows authorities and hospital operators to identify risk areas and take action before shortages arise. It can be rolled out across nations and applied to other medical capacity questions as well as different areas, such child care facilities, schools and public transport.
The jury was comprised of high-profile members, including the leaders of top European innovation, investors and technology business networks. During the award ceremony, they highlighted three characteristics of the technology: The clear impact of the solution with an immediate applicability in a real crisis situation; the scalability into many countries where the same urgency can occur; and, furthermore, the potential of a product that can be expanded to other use cases.
The hackathon, which took place May 1-3, was organized by European innovation body EIT Digital. “This is by far not the first DeepHack that we organize, but it was the first fully online DeepHack”, states Chahab Nastar, Chief Innovation Officer of EIT Digital, on their website. “And it was a tremendous success. We received 312 registrations totaling 145 projects. We selected 20 projects for the final event, and we have 3 strong winners. Congratulations to all participating teams for their commitment and the high quality of their proposals.”
An international team of five Targomo engineers took part: Jacopo from Italy, Jan from Germany, André from Brazil, Daniel from the Czech Republic and Hugo from France. “This is a great achievement by our engineers, who developed this tool with a lot of engagement and passion,” says Targomo CEO Patrick Schoenemann. “Leveraging our expertise in location intelligence and artificial intelligence, they’ve demonstrated that our technology can help tackle this pandemic.”
Watch the award-winning video pitch below and see how the tool works.
The development of the technology is supported by the BMBF (FKZ 01IS18010A)
The coronavirus outbreak has highlighted the need for sufficient capacities of intensive care (IC) beds. Targomo engineers have developed a tool to predict risk areas in IC capacities and take action before shortages occur. The analysis can be rolled out across nations and applied to other service coverage questions as well as different areas, such child care facilities, schools and public transport.
The covid-19 pandemic has led to a huge rise of intensive care patients who need extensive treatment in hospitals and clinics. The outbreak has forced some authorities to set up emergency hospitals or move IC patients to other regions or countries, where the virus had not yet infected many people.
Faced with this problem, Targomo data scientist Jacopo Solari and colleagues developed an analytical tool to calculate the need of IC beds or IC units at a local, regional and national level. They combined pandemic and hospital data with census figures and a reachability analysis to model demand for IC beds. Based on real-time data and assuming certain scenarios of how the outbreak could develop, they were able to predict where a shortage of IC beds could arise.
The tool, developed during an EU-backed hackathon on May 1-3, allows authorities and hospital operators to plan ahead and build up extra capacities before an outbreak expands or decide to move patients to less affected areas to free up IC beds. These steps can prevent ICU shortages, save lives and guarantee an adequate level of medical service locally and across the nation. The analysis won Jacopo and his team an award and €5,000 in prize money.
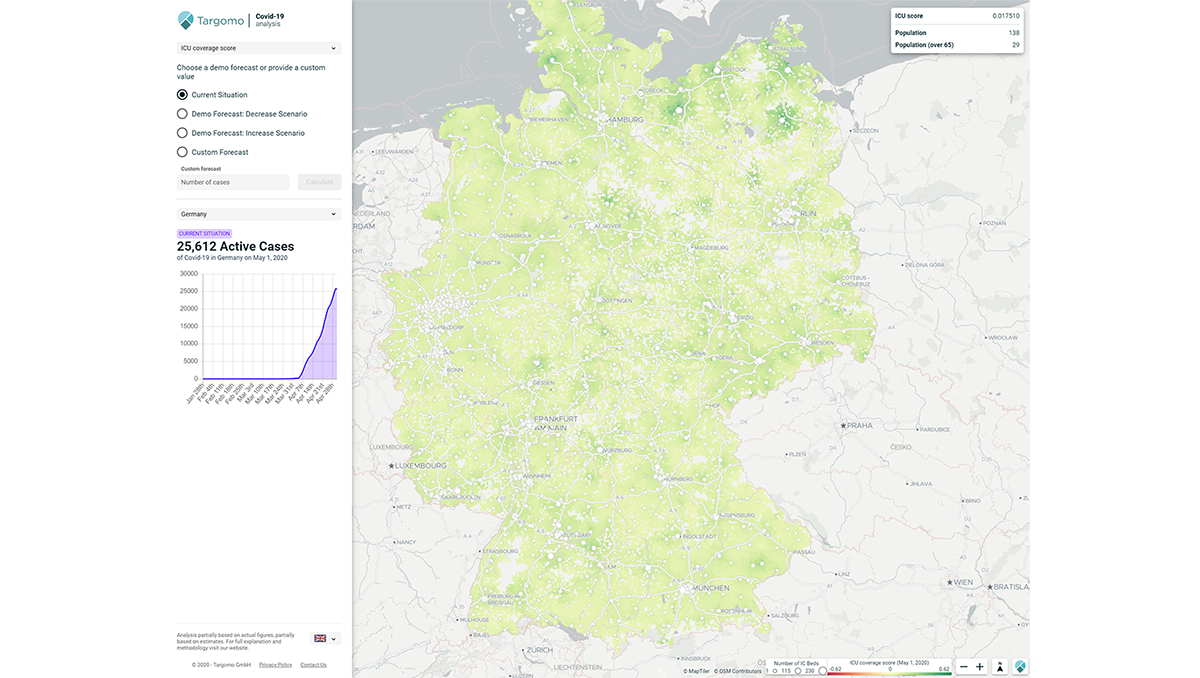
It is important to note the following: The analysis is not a prediction of future covid-19 cases in Germany, but merely a presentation of hypothetical outbreak scenarios. The current situation displays the actual, total number of active covid-19 cases in Germany, but the distribution of covid-19 patients who need intensive care treatment among hospitals is estimated. The number of intensive care patients shown only reflects the number of covid-19 patients who need ICU treatment. It does not include “normal” intensive care patients, meaning people who receive ICU treatment for different causes. The current situation is therefore not comparable to data shown by DIVI, Germany’s association of intensive care specialists, which has collected all ICU data from individual hospitals in a so-called Intensive Care Register. DIVI’s figures are subject to copyright laws and could not be included in the analysis without the organization’s permission.
The text below explains how the tool works in detail. Or, alternatively, watch the award-winning video pitch below and get a brief introduction to the tool.
- Destatis, Germany’s Federal Statistics Office:
- Detailed demographic data, showing how many people of a certain age group live in certain geographic area
- Robert-Koch Institute, Germany’s federal institute for public health and the central body to coordinate measures to contain the covid-19 outbreak:
- Robert Koch-Institut (RKI), dl-de/by-2-0
- Information System of the Federal Health Monitoring, 2015 / Germany’s Federal Statistics Agency (Gesundheitsberichterstattung des Bundes, 2015 / Statistisches Bundesamt)
- Gemeinsamer Bundesauschuss, a federal agency which collects all types of data about Germany’s hospitals and clinics:
- Quality Report of Hospitals for the year 2017. The report was published in 2019.
- The Quality Report of Hospitals has only partially been used. A comprehensive overview of the Quality Report of Hospitals can be found here: www.g-ba.de/.
- Only three variables were used from the report: number of hospitals and their exact locations, total number of beds per hospital, whether a hospital offers intensive care treatment or not.
- The Quality Report of Hospitals is used here in conjunction with other sources of information. Therefore, the recommendations and results given do not represent an authentic reproduction of the quality reports. For a complete presentation of the quality reports of hospitals, please refer to
www.g-ba.de.
- OpenStreetMap / OSM Contributors:
- Location and road data, and reachability analysis to calculate travel times from a home to a hospital
The analysis builds on several data sets to estimate the number of IC beds needed in single hospitals:
- Real-time number of active covid-19 cases and an estimation of the fraction of infected people needing IC treatment. When available, actual figures of people in intensive care can be included in the analysis of the current situation.
- Geographic locations of a nation’s hospitals and clinics offering intensive care treatment and the number of IC beds available per hospital.
- Census data, showing how many and where people live in a specifically defined location, known as census cell.
- Reachability analysis: routing data to predict in which hospital covid-19 patients will most likely receive intensive care treatment.
Reachability and census data
The reachability of hospitals is crucial for the analysis: Patients are most likely to receive treatment in medical centers that are nearby. Because time and quick help is essential to offer relief and increase chances of survival, covid-19 patients will most likely visit hospitals in their immediate vicinity.
Combined with census data, which tells us how many people live in a certain region, the reachability analysis will show which hospitals will receive how many covid-19 patients. Simply put, locations that are nearby will attract more patients from their immediate vicinity. The tool assumes that covid-19 patients will drive a maximum of one hour to visit a hospital in their region.
The reachability analysis allows us calculate a so-called ‘ICU coverage score’ for each geographic area, which is defined as the area for which census figures have been collected. The latter is known as a census cell.
“We used reachability, or to be exact, the inverse of travel time to calculate which patients are ‘drawn’ to which hospital,” says Jacopo Solari, who holds a Ph.D. in physics. “The further away a hospital is from a census cell, the less impact it will have on the score of that cell.”
With their model, Jacopo and his team can calculate and visualize two important outcomes:
- The level of IC capacities or coverage score for each geographic cell. This shows whether people in an area (a census cell) have decent access to IC beds in their immediate surroundings. It is computed as the sum of the bed balances (number of IC patients – number of IC beds) for surrounding hospitals, divided by their travel time.
- The number of covid-19 patients in need of IC treatment for each hospital. It answers whether a hospital has enough IC beds available or not to treat covid-19 and other patients, who need intensive care treatment.
Visualize scenarios and take action
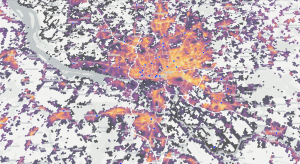
The tool will show on a map where IC coverage is sufficient, near its limit or inadequate. For Germany, the current situation is reassuring as the number of covid-19 patients needing IC treatment is well below available IC beds across the nation, as depicted in the picture at the top.
The tool’s value becomes evident when different scenarios are analyzed, specifically the ones where the number of covid-19 cases, and, subsequently, the number of people in need of intensive care treatment, rises dramatically.
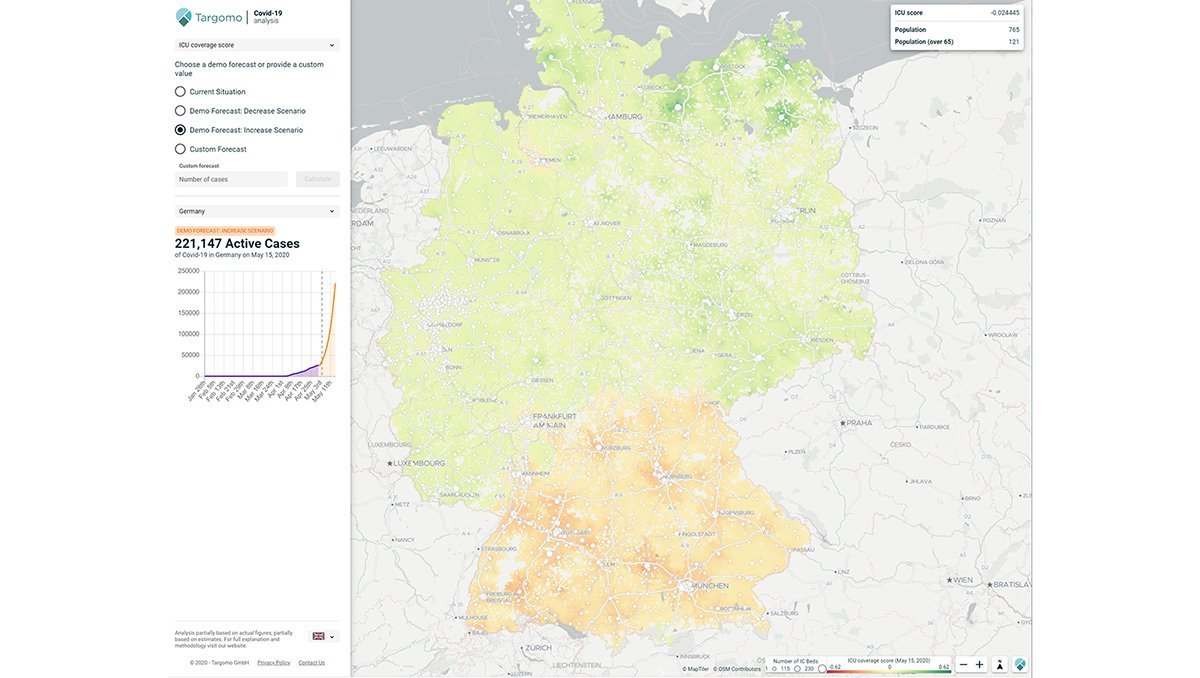
The map below shows how the German states of Bavaria and Baden-Württemberg would lack the capacities to treat covid-19 patients, who need intensive care help. Visualization helps to immediately identify the risk areas. As an additional aid, demographic details for each census cell are highlighted in the top right corner: total population at a location and the number of people over 65.
Map showing ICU coverage score for Germany assuming a scenario of an increase in the number of active covid-19 cases. G-BA’s Quality Report of Hospitals has only partially been used. A comprehensive overview of the Quality Report of Hospitals can be found here: www.g-ba.de/. The Quality Report of Hospitals is used here in conjunction with other sources of information. Therefore, the recommendations and results given do not represent an authentic reproduction of the quality reports. For a complete presentation of the quality reports of hospitals, please refer to www.g-ba.de.
Analyze individual hospitals
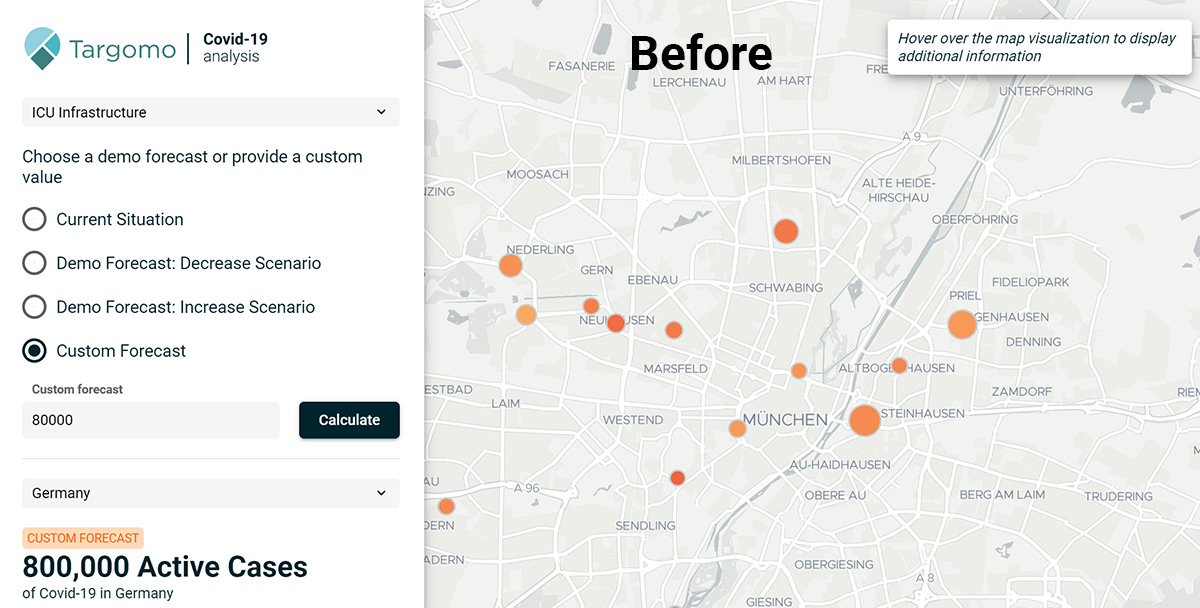
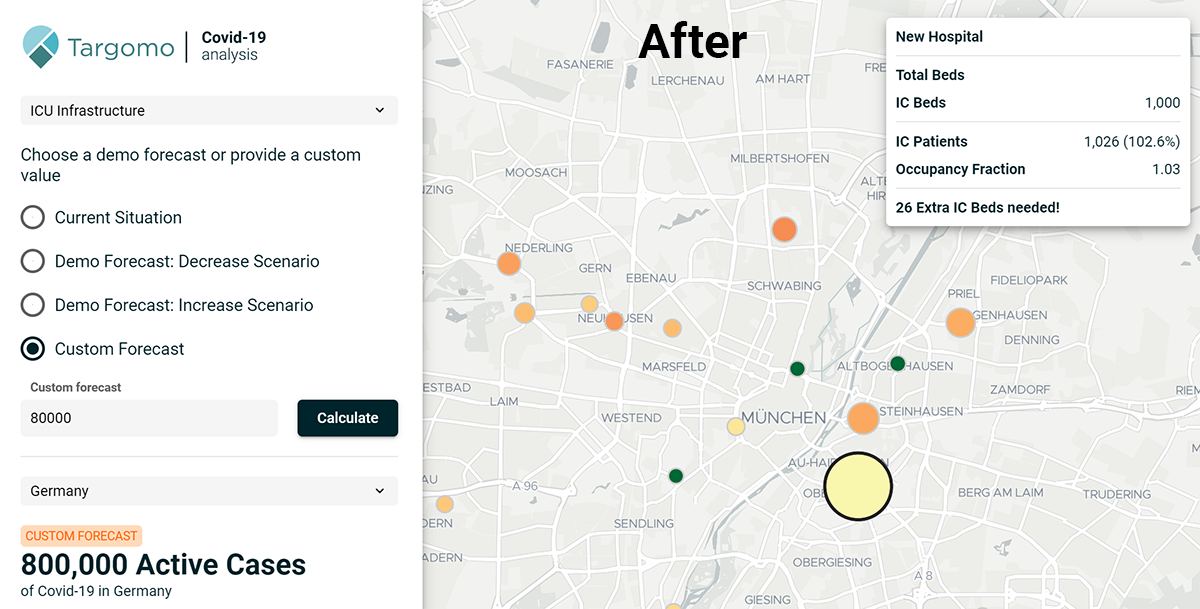
The tool is also powerful at the hospital level. The map allows users to toggle between the ICU coverage score (the map is colored) and individual hospital, displayed by the dots on the map. Once hospitals are visible, users can see how many IC beds each hospital has and whether there is shortage of beds or not. Users can add a new, temporary hospital to see how this would improve the situation, as shown in the two pictures below.
G-BA’s Quality Report of Hospitals has only partially been used. A comprehensive overview of the Quality Report of Hospitals can be found here: www.g-ba.de/. The Quality Report of Hospitals is used here in conjunction with other sources of information. Therefore, the recommendations and results given do not represent an authentic reproduction of the quality reports. For a complete presentation of the quality reports of hospitals, please refer to
www.g-ba.de.
The tool also allows users to pick a random outbreak scenario by entering the number of active covid-19 cases in a country, in the example, Germany. The ‘Custom forecast’ can be used by epidemiologist to put their own predictions into the tool. They can then instantly visualize the effect of their own state of the art disease-spreading model.
Scalable: Other use cases
The analysis does not only apply to ICU service quality, but for any type of medical service, such as the number of places to treat people with heart problems or geriatric ailments. By changing the data sets, the same analysis and insights can be obtained. The tool also allows users to analyze service quality questions outside the medical realm, for instance the number of child care or school places in a city, whether the quality of education is deemed sufficient (as measured by exam scores).
International use is also easily feasible, by taking data from other countries or regions. For instance, if the state of New York has data available, the analysis could be made in a couple of hours. The analysis can be made for any country in the world as long as the necessary data is available.
Jacopo and his team have used different data sources for the analysis. A full list is given further down, but the most important data sets are the number of covid-19 cases provided by Germany’s federal health institute, or Robert-Koch Institute, and an estimation fo the number of intensive care beds per hospital. The latter figure is derived from the number of ICU beds per German state and then proportionally allocated to each hospital in a state, by dividing it by the total number of beds in that state. It is assumed, that the number of intensive care beds is linearly related to the total number of (normal) hospitals beds.
The analysis assumes that a certain number of covid-19 patients needs intensive care treatment. Currently, this number is set at 0.0075, meaning that 0.75% of active covid-19 cases end up in hospital. This number is based on the most up-to-date figure from the Robert-Koch Institute.
- Destatis, Germany’s federal statistics office:
- Detailed demographic data, showing how many people of a certain age group live in certain geographic area
- Robert-Koch Institut, Germany’s federal institute for public health and the central body to coordinate measures to contain the covid-19 outbreak:
- Number of cases over time per at the state level
- Gesundheitsberichterstattung des Bundes:
- Number of ICU beds per Bundesland
- Gemeinsamer Bundesauschuss, a federal agency which collects all types of data about Germany’s hospitals and clinics:
- Number of hospitals and their exact locations
- Total number of beds per hospital
- Whether a hospital offers intensive care treatment or not
- OpenStreetMap:
- Location and road data, and reachability analysis to calculate travel times from a home to a hospital
The analysis would improve if DIVI, Germany’s association of intensive care specialists, would grant access to its real-time data of all intensive care units in Germany. DIVI has collected an overview of all of total available IC beds and occupied beds in Germany and updates the list daily.
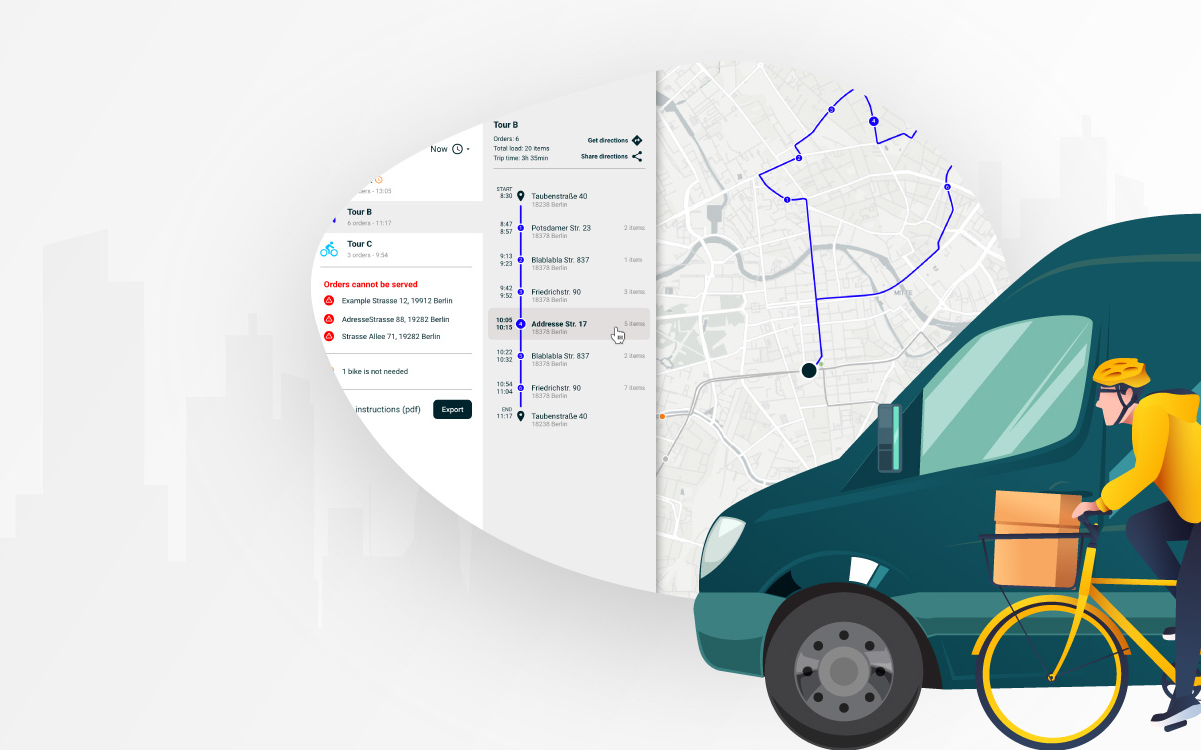
To help businesses, organizations and people during the coronavirus pandemic, Targomo is offering a route- and delivery-planning service. The tool, TargomoFLEET light, will help users to quickly plan optimal routes for one or several vehicles, including bicycles, whether to deliver goods door-to-door or plan patients visits. The platform is available here: app.targomo.com/fleet
The coronavirus pandemic has forced many shops and restaurants to close their doors and triggered a boom in delivery services. To help local businesses and organizations get their products and services to customers and keep their business running during the crisis, Berlin-based location intelligence startup Targomo has developed a route- and delivery-planning service. With just a few clicks and free of charge, users can schedule the best routes for their deliveries.
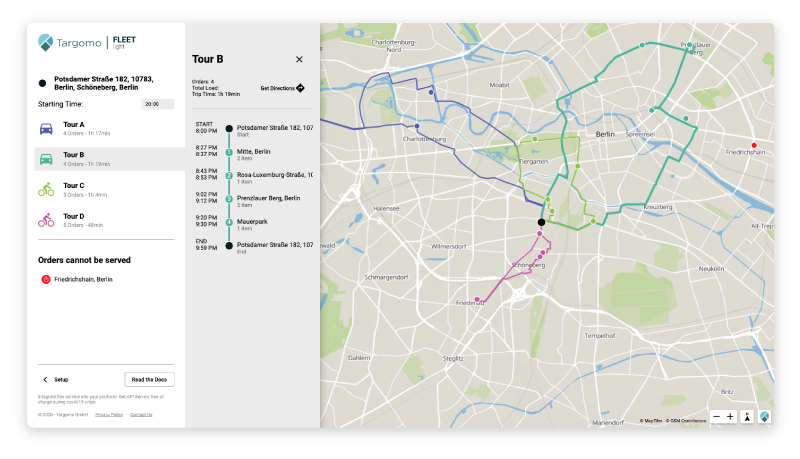
While ordinary navigation services only allow to plan routes from A to B with some stopovers and for a single vehicle, TargomoFLEET light calculates routes for up to 30 stops and fleets of up to five vehicles and bicycles each. For both types of transportation, the user can specify load capacity, the maximum time per trip, and the average time with a customer.
“In many countries, the lockdown has a devastating effect on retailers and other businesses,” says Patrick Schoenemann, CEO of Targomo. “We’d like to use our expertise in geoanalytics, artificial intelligence and routing to help those affected and keep their business running. I am proud of the Targomo team, which has shown great commitment in the development process.”
Calculating the Optimal Delivery Route
The idea for TargomoFLEET light was born during a hackathon, which the Targomo team held over the weekend. The goal was to use location intelligence technology during the coronavirus crisis in a meaningful way and to help those suffering from the pandemic.
The tool uses complex routing algorithms to calculate the optimal delivery routes within seconds, and make the delivery as efficient as possible. Not only retailers can benefit from the delivery and route planner. The technology also allows doctors, nurses or health authority employees to determine the optimal routes for their customer or patient visits within a very short time. TargomoFLEET light is now available.
TargomoFLEET light at a glance:
- Efficient route planning for up to 30 stops
- For up to 5 cars and 5 bikes
- Set load capacities
- Set maximum trip time
- Set average time with customers
- Available in English and German
- Online at app.targomo.com/fleet