- Products
- TargomoLOOP
One Platform, Unlimited Insights
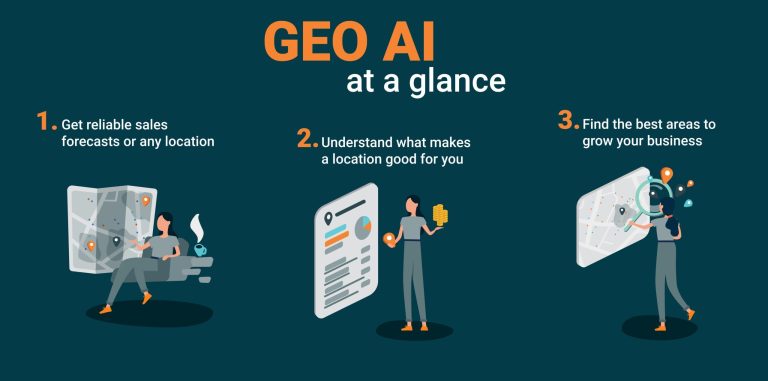
- GeoAI
Turn Data into Accurate Forecasts
- TargomoAPI
Build Powerful Mapping and Location Analytics Applications
- Data
Global Data. Local Insights. Smart Decisions
One Platform, Unlimited Insights
Trusted by the world’s leading brands


- IndustriesLet us help!Can’t find your industry on our list?If your business has multiple locations or physical touchpoints, we can help!


- Resources
- About Us
Login
Book a demo