Book a demo

Archive for the 'Blog' Category

A Leading Real Estate Platform Uses Location Intelligence to Transform House Hunting

Nov 14 2019 Published by under Blog

French real estate platform SeLoger has made it easier for customers to find the home that matches all their needs.

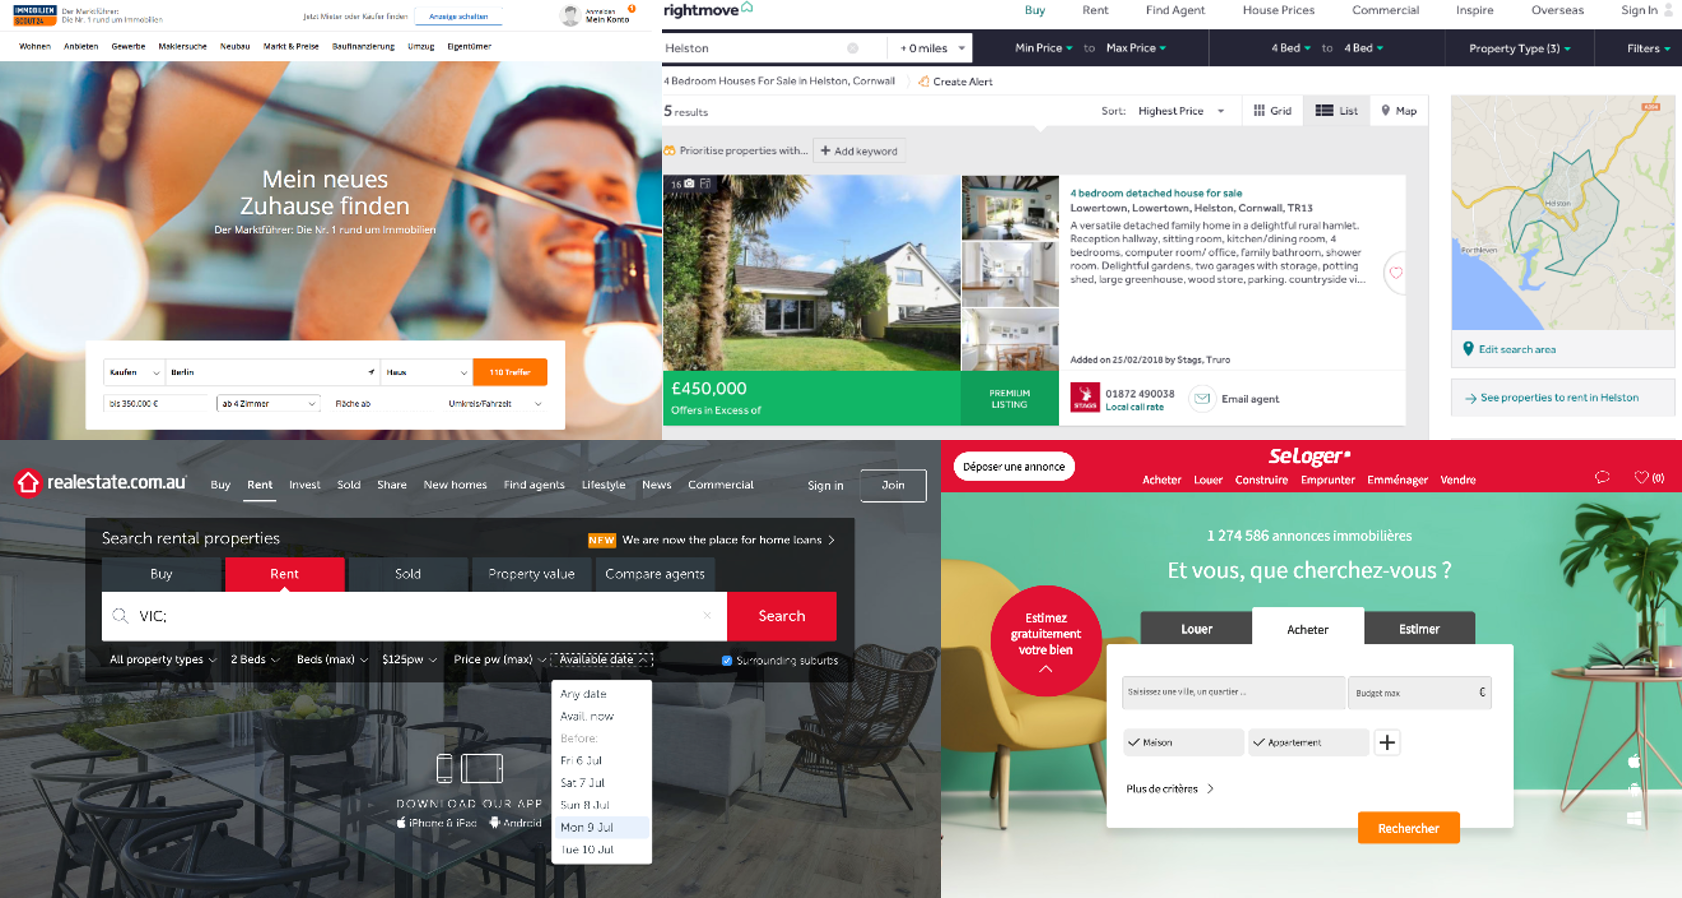
For real estate platforms, staying ahead of the competition isn’t an easy task: house hunting changed little over the years. Do you want a garden? Two rooms? A central location? These standard questions don’t reflect the complexities of life, let alone the hustle and bustle reality of urbanites. SeLoger, one of France’s most popular real estate platforms, introduced a ground-breaking way to deliver a better search experience: house seekers can now filter results by commute times. Targomo made this possible.

The Importance of Travel Time in Real Estate Search

In 2017, SeLoger partnered with Targomo to implement an innovative idea. They realized that searching for a new home by postal code is static and simplistic. Instead, people’s lives revolve around a variety of locations (work, gym, university, kindergarten to mention a few) and the different ways to get there (car, public transport, bike, or on foot). In other words: The location of the perfect home is determined by its relation to the places that matter most and the time it takes to get there.

SeLoger, part of German media and classifieds group Axel Springer, decided to help its 30 million monthly users find a home that reflects life in all its complexity. They did so by incorporating Targomo’s travel time polygons into their platform.

Location Intelligence in Action

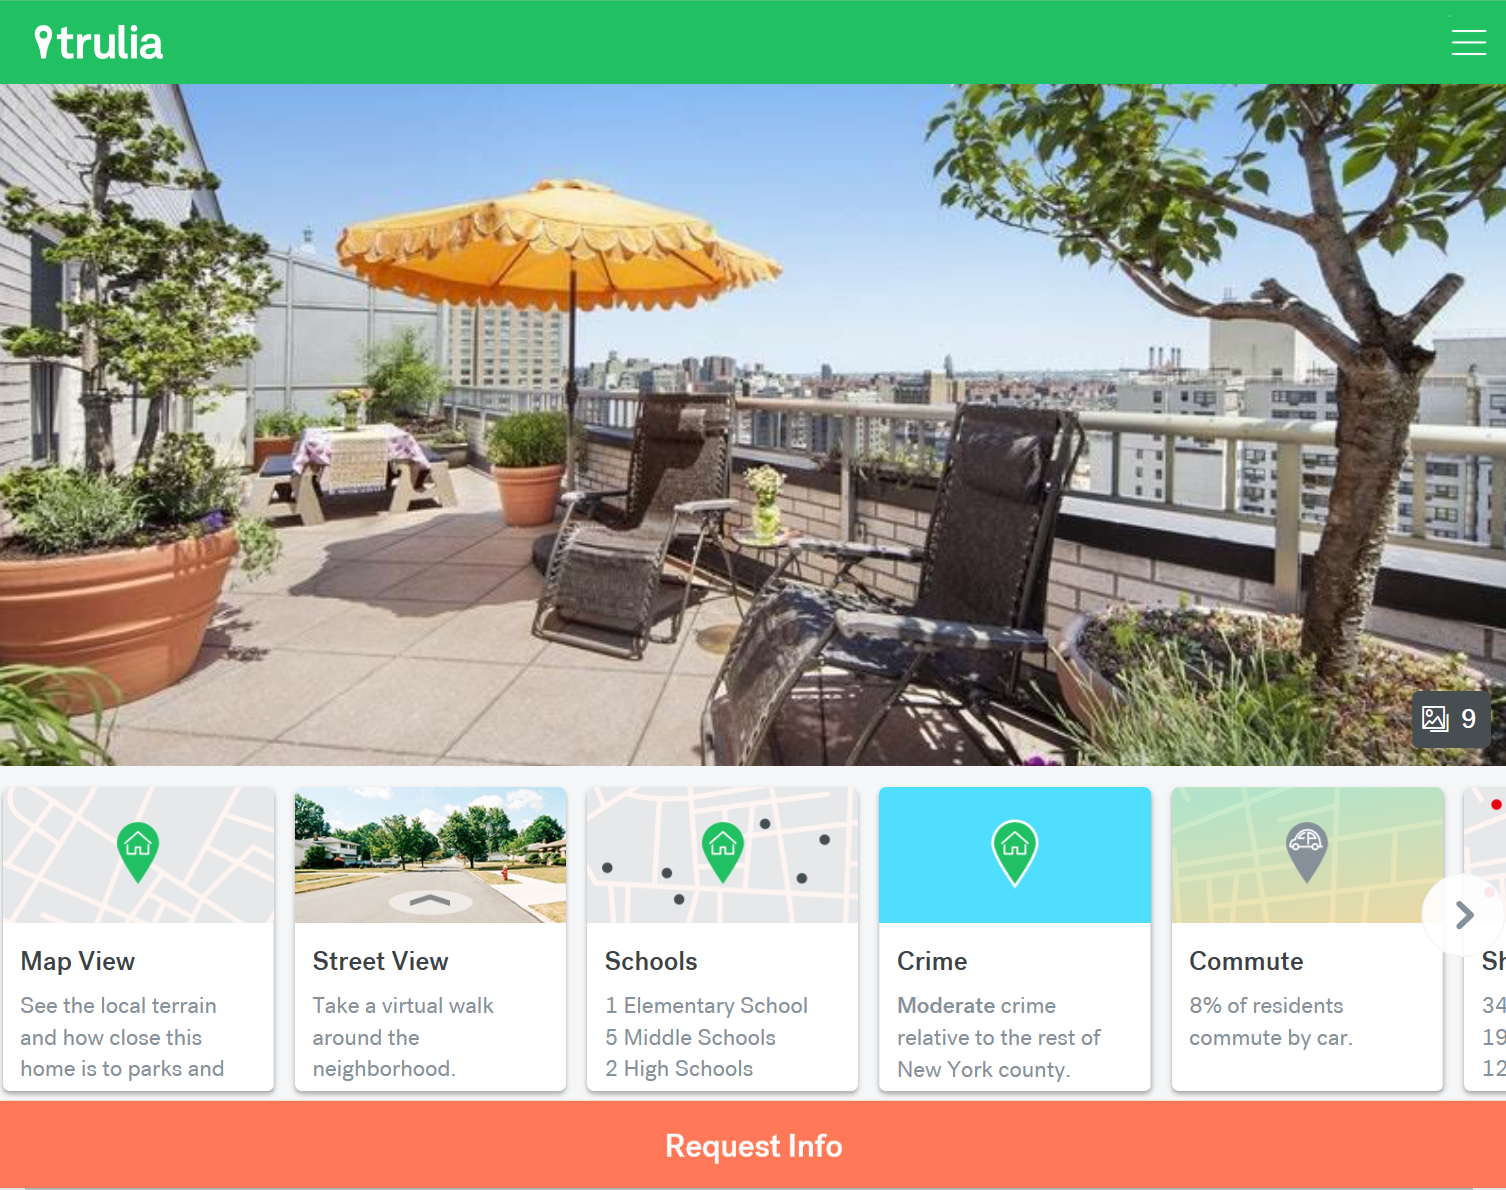
Imagine a parent who wants to limit her drive to work to 30 minutes. At the same time, she wants to live within 20 minutes from her daughter’s kindergarten by public transport. Most real estate platforms wouldn’t know how to answer these requests. But with the help of Targomo’s API, people can use SeLoger to set two places that matter to them, how they want to get there, and how fast.

As a result, listings that fit these preferences are clearly visualized. People can focus on realistic locations and feel confident that their needs are met. As an added benefit, they might discover new neighborhoods they had not considered before.

French real estate platform SeLoger offers its clients a better search experience, allowing them to take into account travel times to their offices, gyms, childrens' schools and train stations.

Integrating Targomo’s API is Easy and Quick

When looking for a partner to implement its new location intelligence feature, SeLoger thoroughly surveyed the market. Ultimately, they chose Targomo’s API for its technical capabilities – Targomo includes several means of transport, allows for multiple destinations, and easily integrates into existing platforms. After only one month, SeLoger launched the new location intelligence feature on their platform.

[quote text=”The Targomo API is technically impressive and easy to integrate. Within one month we were ready to launch our new feature.” type=”long” name=”Amel Taibi” role=”Head of Product at SeLoger”]

Before integrating travel time, only 4% of all home seekers on SeLoger used maps to visualize real estate offers. Most people still relied on lists without spatial context. Today, that number is 10%. In other words: 3 million monthly users rely on location intelligence to find their next homes.

Unexpected Customer Insights and Bold Experiments

Location Intelligence also delivers new customer insights. SeLoger realized that most people prefer to drive up to 30 minutes to their work or particularly look for schools around real estate offers. These insights help the company to continuously improve the user experience.

SeLoger also offers other services in the real estate sector and they believe that location intelligence will be useful in a variety of applications: searching for holiday homes, planning new construction projects or finding the optimal coworking space. Targomo API can help in all these use cases.

Learn more about our services for real estate platforms.

Comments Off on A Leading Real Estate Platform Uses Location Intelligence to Transform House Hunting

Mastering the Digital Challenges in Urban and Rural Areas

Nov 05 2019 Published by under Blog

The Smart Country Convention 2019 provided a great overview of the challenges that digitalization brings to urban and rural areas. We’ve learned a lot from the bright and purpose-driven speakers, presenting their innovative solutions and strategies.

The digitalization of the Public Sector, in Europe and in Germany takes place in societies that are heavily urbanized. Urban areas are currently housing 72% of the EU-28’s population. Rural populations on the other hand showed a steady decline over the last 50 years; in 1960, 35% of Europeans lived in rural areas, compared to 28% in 2010. Germany is not an outlier of this trend.

While digital services can improve and soften the impact of urbanization, they can also exacerbate existing problems. Rapid advancements in technology and social change challenge the political realities on the ground and public officials need to show that they are able to create a smart and sustainable future for their citizens.

The challenges of digitalization also differ vastly between rural and urban areas, especially when it comes to mobility and the provision of public services. In recent years, cities have witnessed a profound change in mobility patterns. New forms of individual mobility services such as car-, ride- and bike-sharing shape our daily lives. These services lead to new spatial demands, like designated parking facilities and charging infrastructures. While traffic behaviour in German cities is increasingly multimodal, the private car remains the number one means of transport in rural areas: 72% of residents depend on their own car or two-wheeler. Furthermore, 70% of workers living outside urban centres travel by car to work, regardless of commuting times.

Rural areas: Challenges and Solutions

The mayor of Bad Nauheim, Klaus Kreß, presented his city’s approach towards digitalization at the Smart Country Convention. Bad Nauheim, is a great example how digitalization can help a city reinvent itself. Before the reunification of Germany, Bad Nauheim had the oldest population in the whole country. Since then, they decided to tackle this problem head-on with new digital tools while keeping in mind local traditions and concerns. According to the Mayor, there are clear goals for digitalization in the rural context: Problem solving, sustainability and efficiency, enhancing experience and creating an innovative identity. With this in mind, digitalization can be a major driver for sustainable, innovative urban development, but also for more identification and experience. Dr. Stephanie Arens from @suedwestfalen presented a different solution: Coming together as a region. [quote text=”Digital, sustainable and authentic: that’s the DNA of our digital strategy as a region.” type=”long” name=”Dr. Stephanie Arens” role=”Head of Regional Development at suedwestfalen”] Suedwestfalen is a development company founded to develop a concept for a digital future with 59 cities and communities of this West-German region. This innovative private-public venture bundles the strengths of business and politics to set up the region for growth and innovation.

eGovernment on the rise in German cities

Cities are using the benefits of sharing capacities to their advantage as well. The mayor of mid-sized German city Ulm (122.000 inhabitants) described how his city only tackles certain questions like mobility, energy, infrastructure together with surrounding cities. This way they managed to work on a coherent strategy and save costs.

Thomas Bönig (CIO Munich) on stage at the Smart Country Convention 2019

Munich’s Chief Innovation Officer, Thomas Bönig, presented the city’s three strategic pillars for handling the digital revolution: Firstly, meet citizens where they are, don’t stop new developments that emerge from the bottom-up. Secondly, no city is an island, using interdependencies and cross-pollination between cities to be more efficient. Thirdly, it’s crucial to find the middle ground between individualized focus and standardized best practices.

All of these efforts are bundled under one umbrella agency, Munich Digital. Their vision: Make Munich by 2025 a future-oriented and sustainable metropolis that uses digitalization actively and responsibly – for the benefit of its citizens, making it possible for everyone to digitally experience Munich.

Smart City Index: Quantifying German digitalization

While these anecdotes were certainly enlightening, Bitkom Research went one step further to understand the whole picture of Germany-wide digitalization. They collected, checked and qualified a total of 7,800 data points. All 81 German cities with at least 100,000 inhabitants were evaluated in five areas: Administration, IT and telecommunications infrastructure, energy and the environment, mobility, and society. Learn More

The 20 smartest German cities according to bitkom.

While many of the examples mentioned in this article and the Smart City Index, are shining examples of a smart future, it is also clear that the road ahead is difficult and mistakes will be made.

Location Intelligence’s role in managing the digital transformation

One example for the difficulties of digital solutions are E-Scooters. We already touched upon this phenomenon in this recent blog post. Right now, the research suggests that e-scooters are nothing more than another mobility gadget for urbanites: They dominate in city centers but are mostly vacant in outer-city areas where they could solve the problem of the first mile: Getting people to the next public transport station, and thereby eliminating the need for expensive infrastructure expansions to all corners of urban settlements.

With Location Intelligence, city planners can better arrange parking zones and routes and make a tangible impact on public transport efficiency.

The electrification of public transport networks in Europe will be an iterative process that changes with the needs, quantity and preferences of its citizens. Such networks will need to be flexible and open to new electrified vehicles for urban transportation. Targomo’s data-driven approach can help public sector officials optimize the planning phase of electrified public infrastructure projects, analyse the results after implementation, and effectively plan for future projects.

We are already helping our innovative customers such as Ruter#, Oslo’s public transport authority, to optimize their public transport network and deliver better services to their citizens.

Are you interested in how Location Intelligence can support the Public Sector? Find out more on our website.

Comments Off on Mastering the Digital Challenges in Urban and Rural Areas

How Open Data Can Make Cities Smarter – And What Is Holding Them Back

Oct 29 2019 Published by under Blog

When visiting this year’s Smart Country Convention in Berlin, one gets the impression that cities and municipalities globally are more or less on the verge of becoming “smart”. But is that truly the case? We found some lighthouse examples and one of the biggest obstacles on the way to a smart future.

As we support the public sector, we participated in the Smart Country Convention Berlin last week. This forum for the exchange of strategic advice provided the opportunity to learn more from experts about the current state of affairs. While most cities are facing unique situations on a granular level, many places struggle with similar challenges. This year’s partnering country – and role model – was Lithuania. For them, becoming smart was the most pragmatic choice: “We’re not big, we’re not rich, so we have to be smarter”, their Foreign Minister Linas Antanas Linkevičius explained.

The impressive Baltic state has been so successful in fact, that its capital city Vilnius is overwhelmed by the incoming UK tech companies looking for new places to run their business. The city’s recipe for success consists of both top-down and bottom-up approaches. By creating the optimal legal frameworks and infrastructure conditions, the government paves the way for young companies to thrive with new business models.

Vilnius: The Impact of a Radical Open Data Policy

Some of these companies are working towards new transport solutions, with good reason: “Regardless of size, all cities have mobility issues”, the mayor of Vilnius, Remigijus Šimašius said on stage. Once citizens establish routines, adjustments are difficult because of inherent resistance to changing habits (individual car ownership for example).

The mayor of Vilnius, Remigijus Šimašius, is presenting the city’s innovation approach at Smart Country Convention Berlin: “The mobility experience starts with leaving the house”.

The mayor reminded us that the main beneficiaries of mobility are neither the municipalities nor the service providers, but the people. Mobility should not be an end in itself. Instead, mobility solutions should focus on the benefits they bring to their users.

The starting point of innovations should be micro-decisions of citizens as opposed to some overarching goal. But how to tackle all these challenges? One way, Vilnius decided, was a radical open data policy. Vilnius claims to be one of the first in Europe to create a public city data platform that provides open-source data for all businesses and citizens – “without excuses”.  As a consequence, since September 2017 it’s the home of Trafi, one of the most advanced mobility apps in the world. Trafi bundles all public mobility solutions, making it easy to navigate the city without a private car. This is not a one-way success story tough. Trafi provides the city administration with so much new data that it’s fundamentally changing traffic planning.

Other cities are also impressed: Recently, Trafi and the BVG (Berlin’s transit agency) launched Jelbi, to bring the same mobility experience to the citizens of the German capital.

Low Quality and Bad Coverage May Render Open Data Unusable

But if igniting the spark is so easy, why are many city governments struggling to follow that open data approach? In our daily work with open data sources from all over the world, we encounter a wide range of problems. Two of the most significant ones: Coverage and quality.

We’ve created a map that shows all open data on public transportation throughout Europe. The differences are significant, even within individual countries.

For many of our customers, precise travel time analysis with public transport is key for answering their mobility questions. Integrating public transport data for Germany alone means using data sets from more than 80 federal transport authorities, many of which have to be contacted personally and may be reluctant to share their data. Consequently, it’s almost impossible to create a complete picture of Germany’s public transport landscape at this moment.

On the other hand, good intentions on their own aren’t enough, the correct execution is equally important. Large-scale data sets need homogeneous structures. Lina Bruns, a research assistant at Fraunhofer FOKUS, demonstrated at the Smart Country Convention how minor syntactical inconsistencies in data descriptions – such as putting a phone number as either 040/9595 or 040-9595 – can cause considerable additional effort, while incomplete data sets can quickly render all available information unusable for the majority of analytical purposes.

Bruns argued that agencies lack strategy, processes, tools, or resources to make sure their data solutions fulfill the necessary quality requirements. To help them, FOKUS released new guidelines this week for the improvement of data and meta-data quality, focusing especially on the necessary setup and structure of data.

While this is certainly a great help for those who already have an open data strategy, we hope that events like the Smart Country Convention convince more government agencies that they need one in the first place.

Comments Off on How Open Data Can Make Cities Smarter – And What Is Holding Them Back

For Real Estate Search, Disruption is Around the Corner

Sep 17 2019 Published by under Blog

In terms of real estate search, it seems as if little has changed in recent years. Today, it seems to be only a matter of time until new technologies, based on big data, will radically change the customer experience in the real estate search market.

The last major revolution of property search happened about twenty to twenty-five years ago. Back then, the only way to find properties was either by engaging a realtor or by studying print media. This meant tedious and time-consuming screening of property ads and finding supra-regional real estate was almost impossible. Everyone was completely dependent on the realtor – from property owners, landlords, tenants, to buyers. Nobody was able to get a complete, transparent overview of the market.

Later, in the late 1990ies, the first online real estate platforms such as immowelt.de (1994), followed by realestate.com.au (1995), seloger.fr (1996), immobilienscout24.de (1998), rightmove.co.uk (2000) and trulia.com (2004) were on the rise, and with them, property search underwent a radical Transition.

Various Real Estate Portals

User-friendliness as the key to success

Online market places such as immowelt.de dramatically revolutionized the real estate market. Suddenly, it was possible for the user to search for supra-regional properties and comparing prices became effortless; a single ad reached a significantly bigger audience and administrative expenses decreased for landlords, realtors, and property owners.

The time-consuming search for real estate got easier for property seekers as well. Potentially avoidable on-site visits were prevented, as preferences regarding price and facilities simply could be entered online. Comparing real estate had just become a whole lot easier. It was this new level of user-friendliness that caused the major shift away from print media and towards the online segment in the real estate portal business.


Little innovation due to low competition

Today, the market is well represented by up to three real estate platforms in each country with little differences among each other. The reason is simple: the way prospects can search for property has stayed the same for twenty years. While there are different versions for various devices and the design is more appealing than twenty years ago, the underlying search mechanisms remained the same. The user has to know where and what kind of property he or she is looking for. In consequence, real estate portals only benefit those who have already made up their minds by about 80%.

Yet, the decision-making process for real estate works completely different. Rather than considering whether the portal’s displayed ads are a fit, prospects want to decide on the basic qualifications of a location and its surroundings first.


Intelligent algorithms already help in the early stages

Choosing the right location is a highly individual decision and normally beings with questions of connectivity and travel times from and to potential places of residence. This is a simple task for a prospect who has already decided on one or more potential locations. However, since all online analysis tools require a more or less specific location to start the search, if one hasn’t decided on a location yet, current online solutions won’t be able to help. That being said, today’s technology is already capable of doing what the prospects need – choosing the best location by considering certain demands.

Here’s an example:

Person A’s workplace is in Oxford Street and his/her partner works at Trafalgar Square – both want to reach their workplaces in approximately the same time. Which areas should they consider for their new apartment?


Targomo's Reachability Analysis

Image Source: Targomo.com – Demo British Isles; Calculation of travel time with public transportation in London; displayed in polygons

The graphic above shows potential places of residence from which both can reach their workplaces in approximately the same time. Using this technology, the map also reveals certain patterns which no one, including experienced realtors, could have predicted.


Current solutions miss out on the technological potential

In the mentioned example, the prospect can now compare and evaluate the various displayed suggestions for a place of residence. In this context, surroundings of a potential location play a vital role. Depending on one’s individual requirements, different questions emerge:

  • How good is the care and supply situation regarding doctors, kindergartens, schools, municipal institutions, and others?
  • What does cultural life offer: restaurants, bars, bakeries, cafes?
  • What is the neighborhood like?
  • Is the district safe?
  • What kind of sports clubs exist?
  • Is there sufficient parking?
  • How high are the rental prices?

All these aspects must be part of the analysis now. There is plenty of data available for these questions and, partially, platforms are already visualizing single aspects such as kindergartens and schools in the surrounding area.

Real Estate Platform Trulia

Image Source: Trulia.com; a good example how the US property search portal takes some of this data into account.

Yet, most portals require a specific location as a prerequisite to take these aspects into consideration. This means that although it’s possible to create an environment analysis for a single real estate offer, this information doesn’t provide any value for someone who wants to choose their location depending on the surroundings – and not the other way around. The prospect wants to make a weighed decision regarding the potential place of residence.


New technology is here – disruption is coming

Interestingly, state-of-the-art technology is already capable of processing the available data to compare different regions, and to find the potential place of residence without looking at a single listing – promising to significantly simplify real estate search.

Looking into the near future, the next generation of real estate portals will move the prospect’s needs into the center of attention – because as history has shown before, it’s what users like that wins the race.


If you’re interested in upgrading your real estate portal, you can download our free Whitepaper. It gives many details on how to use our API in order to grant your users a new search experience.

Comments Off on For Real Estate Search, Disruption is Around the Corner

How to Select the Ideal Branch Location with Science

Aug 01 2019 Published by under Blog

When it comes to location assessment, even the most state-of-the-art retail businesses still rely on methods prone to subjective biases and errors. This has to change. And it can change, with the help of science. Retail businesses can now take the wheel when it comes to predicting the visitor number and even the turnover of potential new branch locations.


Gravitational Models for Retail

Already in the 1960s, business and marketing professor David Huff developed a mathematical model aimed at identifying the trading area surrounding a retail location, potentially freeing companies from conducting extensive surveys or field studies. He borrowed the main idea from Newton’s law of gravitation: the attraction between two bodies is proportional to their masses and inversely proportional to the squared distance between them. By treating retail locations as bodies with mass attracting customers, the law of gravitation can be effectively applied to the realm of branch network planning.

But why do we think it is worth taking a look at this decades-old idea again? While it never fell completely out of fashion, it didn’t experience a real breakthrough either. Today’s achievements in the science-driven discipline of location intelligence and the modern computational power allow for an effortless and effective application of the Gravitational Model that was unthinkable previously. For retail companies, new insights are becoming available at the push of a button, without having to consult geographers or releasing large budgets.

Geospatial Insights Made Easy

How does it work in practical terms? Well, it all starts with travel time calculations, because this provides a measure of the distance between a branch location and its potential customers. What’s even more interesting is that you can apply the Gravitational Model to your own branch network, effectively addressing cannibalization effects and your competitor’s network. The results display an objective representation of catchment areas with visiting probabilities for both entities:

From these basic steps, the application of the Gravitational Model can and must be fine-tuned in accordance with the individual business strategy. Retail companies with already existing branch networks can leverage their proprietary data on sales, transaction and customer numbers to test the first predictions of the Gravitational Model against real numbers. This allows for the optimization of multiplicative coefficients and exponents in its formula, resulting in the most realistic outputs for potential new locations.

Likewise, the sharper the image of one’s own target group, the more accurately statistical data can be leveraged, and the more efficiently transport and attractiveness variables can be determined. It makes a significant difference if your customers are teenagers traveling mostly by public transport looking for cheap groceries or seniors with cars and a demand for luxury goods. Once this framework fits, Gravitational Models will most likely be one of the tools of your choice when planning a new branch location.

Fascinating, isn’t it? If you’re interested in learning more about Gravitational Models for retail businesses, you can download our free Whitepaper. It’s where you can find a much more detailed description of the science behind these models and also see them in action in another real-life example.


gefördert vom BMBF

Comments Off on How to Select the Ideal Branch Location with Science

How Far can You Travel With Your E-Scooter?

Jul 09 2019 Published by under Blog

Germany’s traffic is undergoing a transformation. Electric cars and bikes have been around for some time now and their number is growing slowly but steadily. However, another electric vehicle is gaining an impressive foothold in major urban areas: e-scooters. When traveling to Berlin, Munich, or Hamburg this summer, it is more than likely you’ll stumble across the latest addition to Germany’s roads. We’ll show you how far you can actually get with them.

The first the e-scooter regulation did not come into force in Germany until mid-June this year, after a long political debate. In a country in which climate change is widely perceived as being one of the most pressing topics, hopes remain high that e-scooters will come in handy as a long-needed green revolution of urban mobility. Being considered a viable alternative to city car traffic, their widespread use promises reduced traffic congestion and lower emissions.

E-scooters offer an independent, flexible, and convenient way of traveling through the city for both tourists and locals, especially for short and medium distances. Accordingly, their number has been increasing drastically over the course of the last three weeks. A recent survey suggests that every fourth German could imagine buying an e-scooter in the future.

New Game, New Rules

Internationally, these environmentally-friendly vehicles jumped onto the scene approximately 18 months ago and are now a common sight from Canada to New Zealand. However, the rules for e-scooters vary widely across the globe. Germany tightly restricts them to bike lanes as well as roads with their speed limited to 20km/h (or 12.4 mp/h). Security concerns further require all vehicles to be officially authorized and their owners must have liability insurance.

Evidently, this new emerging market presents a huge opportunity for both vendors and sharing companies. In the case of Berlin alone, eight sharing services announced their interest to enter the playing field. Among the main competitors currently are Lime, Circ, Tier, and Voi. Their fleet is “free floating”, which means that the vehicles do not require docking and can be left anywhere within their area of service.


Where Can You Go?

Due to their size, weight, and affordability, e-scooters run on comparatively small batteries which have to be charged using a normal socket. While the sharing companies hire “juicers” to recharge the individual vehicles, chances are low the one closest to you will be at 100%. Even with your own e-scooter, the specific range is rarely self-evident. Will you make it to your workplace? Your favorite restaurant? The lake?

To answer these questions in the most intuitive and fast way, we tweaked our travel time API: The map of Germany below allows you to determine the areas you can reach with your e-scooter based on your current location and the remaining power in watt-hours (Wh). You can enter your location manually or automatically share it.


This application calculates the travel distance between your starting position and all surrounding coordinates along bike lanes and streets. It takes into account differences in altitudes, as they strongly influence energy consumption. The model could be further enriched by making it possible to add individual body/baggage weight to the equation. Our API would also allow the integration of POIs such as restaurants and city sights or display the most energy-efficient routes to the destination of your choice. If that would be useful to you, just drop us a line. Have a safe journey!

Comments Off on How Far can You Travel With Your E-Scooter?

TargomoLOOP Sign-up Page

Jan 01 1970 Published by under Blog

Comments Off on TargomoLOOP Sign-up Page

Coronavirus Vaccination in Germany: How Many People Can Reach an Inoculation Center?

Jan 01 1970 Published by under Blog


A map that shows Germany's 446 vaccination centers and the catchment areas of these sites, based on a 30-minute drive.
Reachability in 30 minutes by car – The blue dots represent Germany’s 446 vaccination centers. From all colored areas people can reach a vaccination center within 30 minutes by car. From the gray areas, people will need to travel longer, or no one lives in that area. Source: TargomoLOOP (Enterprise version)

More than 90 percent of Germany’s population can reach a vaccination center within 30 minutes by car, but more than 2 million will need more than an hour’s drive to get there. By public transportation, a significant group will need more than an hour to reach an inoculation center.

Germany has been vaccinating its population since the end of December and has set up 446 inoculation centers around the country. We wanted to know how easily German inhabitants, 83 million in total based on 2018 figures, would be able to reach these locations.

Around 92 percent of Germany’s citizens, or 76.6 million in total, can reach a center within 30 minutes by car, according to calculations in location analytics platform location intelligence platform TargomoLOOP. The remaining 6.4 million people need longer. Almost half of these, 2.7 million, need more than hour to reach a vaccination center. These people live in rural areas, as can be seen in the map below.

A map that shows Germany's 446 vaccination centers and the catchment areas of these sites, based on a 60-minute car drive.
Reachability in 60 minutes by car – All areas colored green can be reached in around 30 minutes. For yellow, orange and red areas the travel time is between 36 and 60 minutes. For the gray areas, people will need to travel longer, or no one lives in that area. Source: TargomoLOOP (Enterprise version)

Reachability with public transportation

The situation changes when public transportation is taken as the travel mode. Within 30 minutes and a maximum of two transfers, only 22 million inhabitants can reach a vaccination center. When a maximum travel time of 60 minutes is allowed, the figures rises to 59.6 million, but that’s still missing almost 30 percent of the population. 

The map below, based on public transportation, shows that especially people in rural areas would be better off if they could drive (or be driven) to a vaccination center by car. 

A map that shows Germany's 446 vaccination centers and the catchment areas of these sites, based on a 60-minute drive by public transportation.
Reachability in 60 minutes by public transportation – All areas colored green can be reached in around 30 minutes. For orange and red areas, the travel time is between 36 and 60 minutes. For the gray areas, people will need to travel longer, or no one lives in that area. Source: TargomoLOOP (Enterprise version)

The ease to reach a location is especially important for senior citizens. For German inhabitants of 65 or older, the reachability percentages drop slightly, but the vast majority can still reach vaccination centers. Within 30 minutes around 88 percent of 17.9 million seniors can reach location by car. Within 60 minutes by car, the percentage improves to 92 percent. Traveling a maximum of one hour by public transportation, only 69 percent of senior inhabitants can reach an inoculation center. 

Luckily, senior citizens aged 71 or older often receive a taxi voucher from the municipality where they live. People living in elderly homes can receive a vaccination where they live so the numbers are even better as this analysis suggests. Mobile inoculation teams can also visit these people and others who are not fit enough to travel. Furthermore, Germany plans to start vaccinating people by their general practitioners in April. These doctors are typically located in the neighborhoods where they live, and would greatly improve the availability and reachability of vaccination locations. 

Curious to make similar analyses yourself? The basic version of TargomoLOOP is free of charge and allows users to quickly gain insights into their locations. Simply sign up and start analyzing.


About TargomoLOOP

Location analytics platform TargomoLOOP supports managers in retail, food service, real estate, public services and logistics to analyze locations and quickly see their potential in terms of catchment area, customer base and reachability. AI-powered predictive analytics allows retailers to identify the success factors of a network of stores and predict the revenue potential of new locations. These insights help managers to plan and optimize their branch network.

The platform’s basic version offers essential features to analyze locations with maps, demographics, and reachable places (also known as Points of Interest). Users can easily rank locations by category and weight. They can correlate location variables with performance. Users can analyze an unlimited number of locations and download reports of their findings. No set-up is required: Simply register, type in an address, and get results within seconds. Everyone can start analyzing for free.

Comments Off on Coronavirus Vaccination in Germany: How Many People Can Reach an Inoculation Center?

« Prev

We use cookies on our website. They provide us with web analytics, helping to give you the best possible experience on all pages. To learn more and see a full list of cookies we use, visit our Privacy Policy

Essential Cookies
Google Analytics
HotJar
We use cookies on our website. They provide us with web analytics, helping to give you the best possible experience on all pages. To learn more and see a full list of cookies we use, visit our Privacy Policy.
These cookies help us understand how you use the website — which pages are most visited, how long users stay, and how they navigate. All data is anonymous. Enabling these helps us improve the site.
These cookies track clicks, scrolling, and how you interact with content. They allow us to analyze usage through heatmaps and session recordings. You can disable these if you prefer not to share this type of data.