Multigraph API
Key Features
- Receive precise measures to every node and edge, based on the actual road network
- Process diverse data (pt, line, hex) and aggregate in dynamic visualizations
Use Scenarios
Network reach using routing_union aggregation type
Visualize the full reach of large retail networks by aggregating to hexagons - also visualize the whitespots which are not covered.
Office location siting using max aggregation type
Find the locations which is closest to all employees by public transport to identify the best areas to locate a new office.
Service area designation using nearest aggregation type
Designate and visualize delivery areas and sales territories - the areas which are closest to each source location.
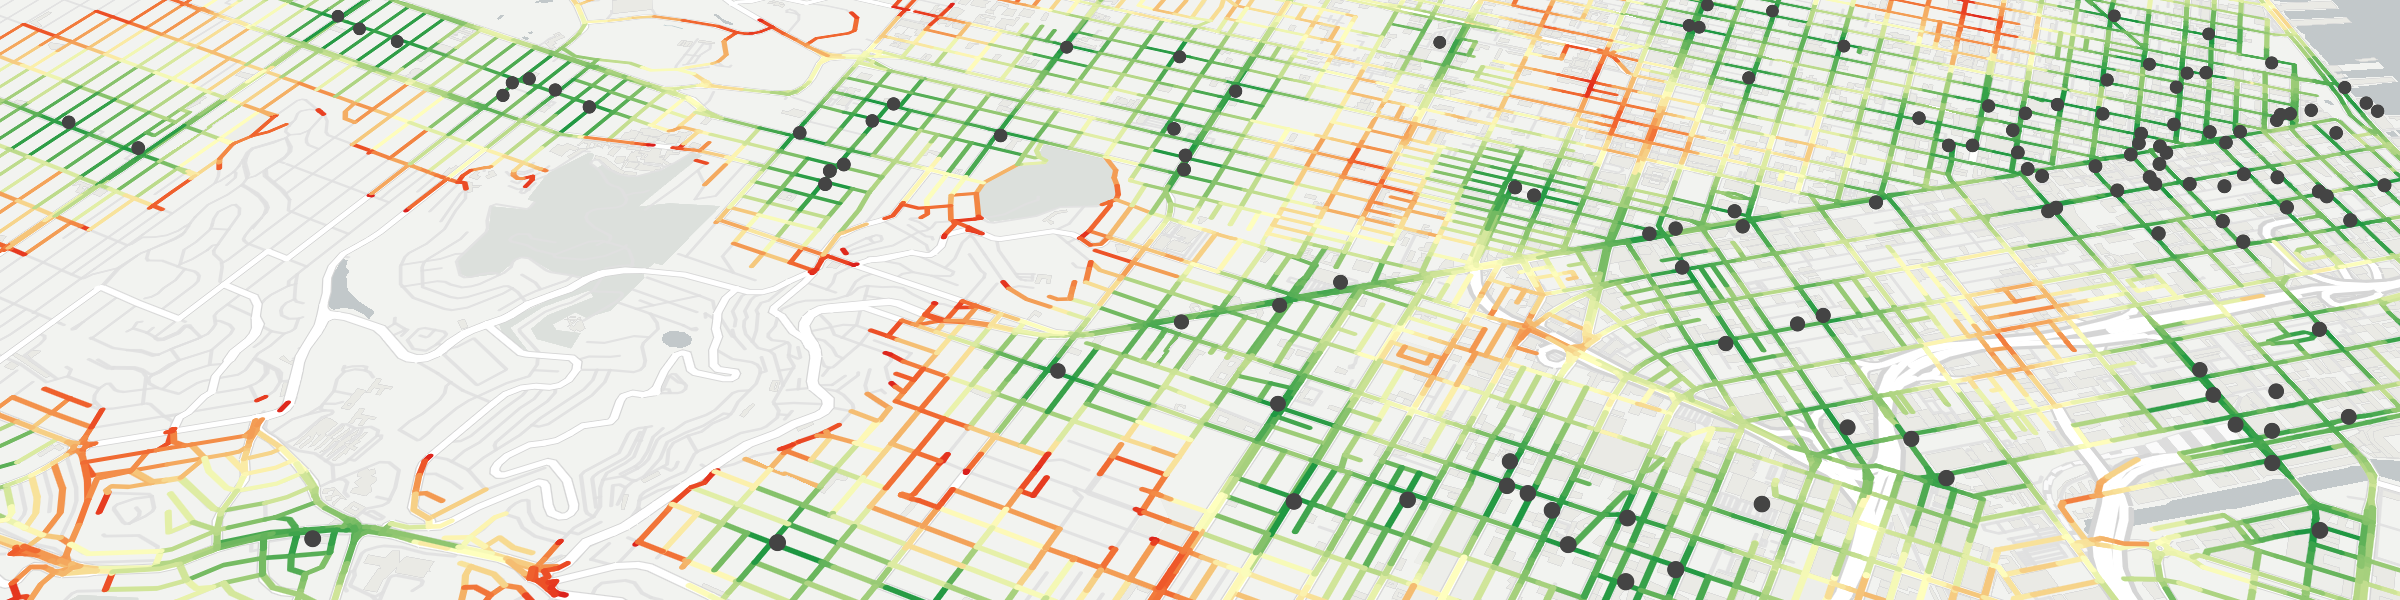
Visualize reachability with non-intrusive edges
The road network itself can be used to visualize the reachable areas, blending cleanly with the basemap.
Inputs
Basic inputs (see docs for more)
- sources: array of starting points
- edge weight: “time” or “distance” optimization
- travel type: “walk”, “bike”, “car”, “transit”
- aggregation: Specifies the aggregation with which the MultiGraph is built from the individual reachability graphs of each source
- “none”, “min”, “max”, “sum”, “mean”, “median”, “nearest”, “routing_union”, “math”, “gravitation_huff”
- layer: Specifies in what form the geometries are returned.
- “identity” (“node”, “edge” or “statistic_geometry”), “tile”, “hexagon”
- serializer: Output format
- “json”, “geojson”, or “mvt” output format
- many, many more…
Outputs
Basic outputs (see docs for more)
- json serializer: Custom json format, in EPSG:3857, primarily used by internal processes
- geojson serializer:" GeoJSON FeatureClass (Polygons, LineString, or Point, depending on
layerconfiguration), WGS84(EPSG:4326), with"w"as the edge weight property - Tiled Outputs
- MVT: Mapbox Vector Tile format, EPSG:3857 with
"w"as the edge weight property - Tiled GeoJSON: ZXY tile containing GeoJSON FeatureClass (Polygons, LineString, or Point, depending on
layerconfiguration), WGS84(EPSG:4326), with"w"as the edge weight property
- MVT: Mapbox Vector Tile format, EPSG:3857 with
Operations counting strategy for public use
maxRoutingtime: each 60 minutes is counted as 1 operation.
sources: each source point = 1 operation.
routing intersections: aggregation types other than routing_union apply a 2x multiplier.
tiled responses: MVT and tiled-geojson results are assigned a 1/15th multiplier.
counting factors are multiplicative…
examples:
- 1 source,
routing_unionaggregation, 60 minutes = 1 operation. - 10 sources,
nearestaggregation, 60 minutes = 20 operations. - 1 source,
routing_unionaggregation, 60 minutes, MVT tiles = 1 operation per each 15 tiles returned.
Explore how the Multigraph API works
Deep Dive on Multigraph
An Observable notebook by Targomo
By @targomo
December 2022