Statistics Context API
Generate valuable insights by combining the reachability of locations with statistics.
Key Features
- Quantify an area and surrounding people through demographic and socio-economic data
- Create info maps by adding a thematic reference layer to illustrate the data
Use Scenarios
Compare the footprint of individual locations
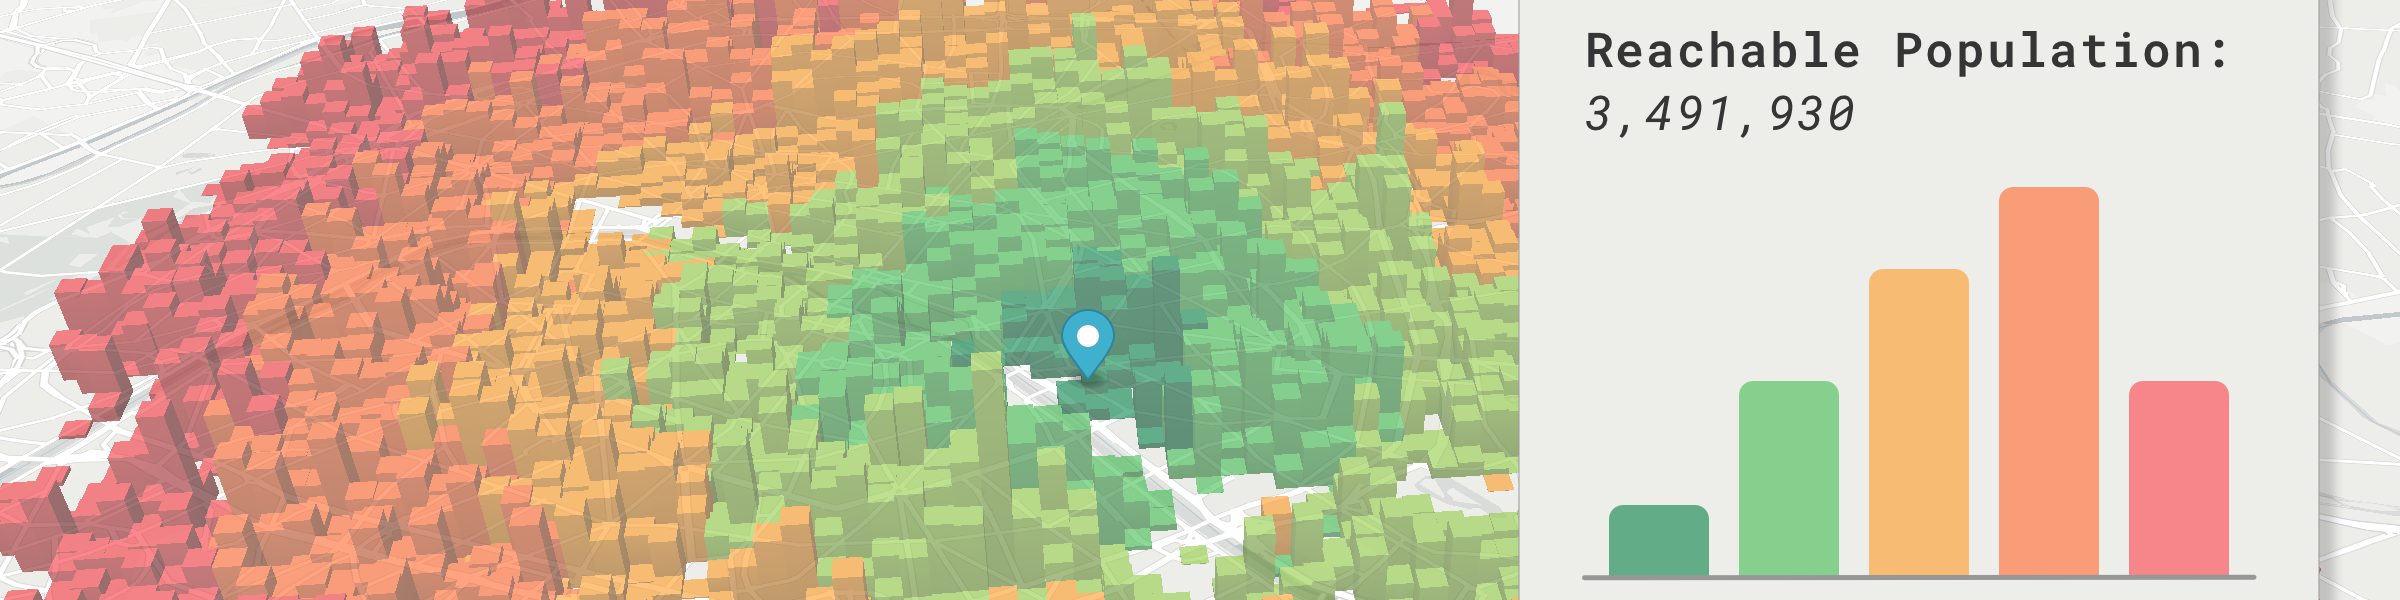
How many people of a target age group are able to reach a restaurant in 15 minutes on foot? Which location reached the most people?
Quantify the number of people who are served by infrastructure
How many people are served by a bus line? What is the impact of removing or adding a stop?
Inputs
Basic inputs (see docs for more)
- statistic group: ID of statistic group (see available groups)
- statistic ids: array of statistic ids from the defined
statistic group - sources: array of starting points
- edge weight: “time” or “distance” optimization
- max edge weight: maximum time/distance to search for places
- travel type: “walk”, “bike”, “car”, “transit”
Outputs
Basic output (see docs for more details)
{
  "statistics": { // summary of statistic values reached
    "0": { // statistic id "0"
      "100": 2345, // sum of statistic "0" within 100 seconds
      "200": 4567, // sum of statistic "0" from 101 to 200 seconds
    },
  },
  "reachableTargets": {
    "100": 50, // how many statistic units were reached within 100 seconds
    "200": 150 // how many statistic units were reached from 101 to 200 seconds
  }
}
Operations counting strategy for public use
maxRoutingtime: each 60 minutes is counted as 1 operation.
sources: each source point = 1 operation.
counting factors are multiplicative…
examples:
- 1 source, 60 minutes = 1 operation.
- 2 sources, 60 minutes = 2 operations.