Statistics Layers API
Visualize additional data by adding reference layers to your map.
Key Features
- Easy integration of reference datasets (statistical/demographic/etc) as vector tiles
- Includes pre-calculated breakpoints for consistent symbolization
Use Scenarios
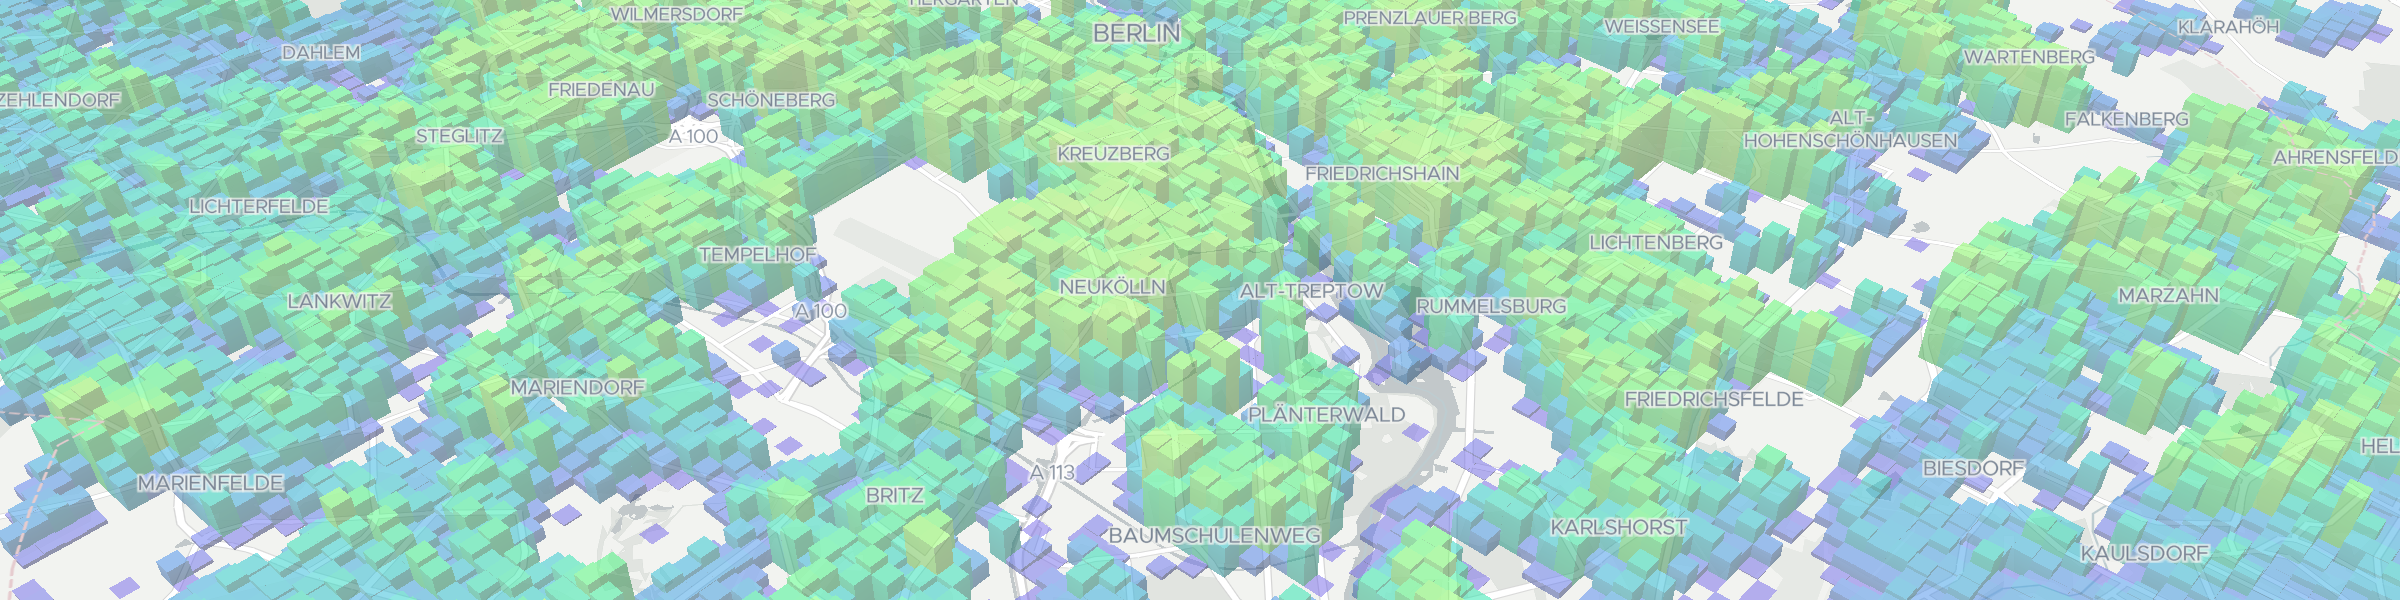
Reference baselayers
Spatially-referenced statistics coverages available as vector tiles (MVT).
Inputs
Basic inputs (see docs for more)
- statistic group: ID of statistic group (see available groups)
- statistic ids: statistic ids from the defined
statistic group(see available ids)
Outputs
Basic inputs (see docs for more)
- MVT: Mapbox Vector Tile format with the layer ID as the statistic group ID, and the statistic id as the value for the statistic in the properties
Operations counting strategy for public use
One tile request counts as one operation.
1,000,000 tiles could be requested with the 300 € monthly use-credit.